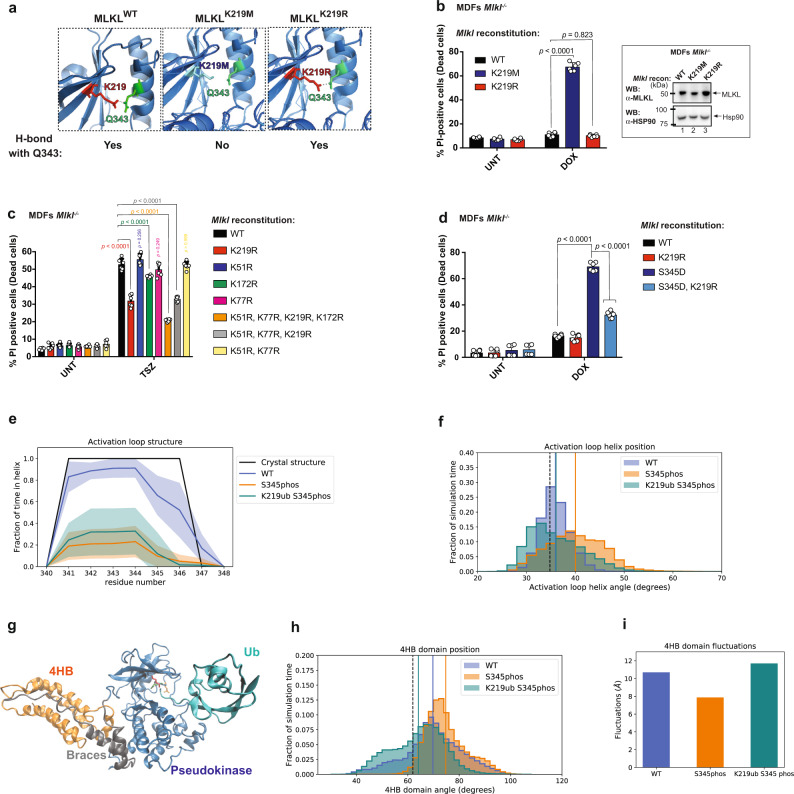
Fig. 5. Ubiquitylation at K219 contributes to the cytotoxic potential of MLKL.
a Pymol model depicting the formation of a hydrogen bond in MLKL mutants. b Quantification of propidium iodide positive (PI+) Mlkl−/− mouse dermal fibroblasts (MDFs) reconstituted with the indicated MLKL mutants and treated for 5 h with doxycycline (DOX, 0.1 μg/ml). The corresponding western blot showing MLKL expression is shown on the right panel. c Mlkl−/− MDF were reconstituted with the indicated MLKL ubiquitin mutants. Cells were pre-treated with DOX (0.1 μg/ml for 3 h) and subsequently treated with TNF (10 ng/ml), SM-164 (100 nM) and z-VAD-FMK (20 μM; TSZ) for 2 h or left untreated. d Quantification of PI+ Mlkl−/− MDFs reconstituted with the indicated MLKL mutants and treated for with DOX (0.1 μg/ml for 5 h). In b–d n = 6 wells/group. The results are representative of those from two independent experiments with three technical replicates each. Data are presented as mean ± SD. Statistical analysis shown was calculated by two-way ANOVA with Sidak’s multiple comparison test. Source data are provided as a Source data file. e Structure of activation loop residues from molecular dynamics (MD) simulations. Shaded area represents standard deviation calculated from independent simulations and the line represents the mean. f Histogram of angle between the activation loop helix and the adjacent helix in simulations. The black vertical dashed line represents the angle in the crystal structure. Solid vertical lines represent the average angle from the MD simulations for each construct (the lines for the WT and K219ub P-S345phos simulations are overlapping). g Ubiquitylated and phosphorylated MLKL from MD simulations. Shown is the pseudokinase domain (blue), the brace helices (grey), the 4HB domain (orange), the Ub moiety (teal) and residues K219 (red), Q343 (green) and S345 (orange). h Histogram of angle between the 4HB domain and the pseudokinase domain in MD simulations. The black vertical dashed line represents the angle in the crystal structure. Solid vertical lines represent the average angle from the MD simulations for each construct. i Overall fluctuations of the 4HB domain relative to the pseudokinase domain.

