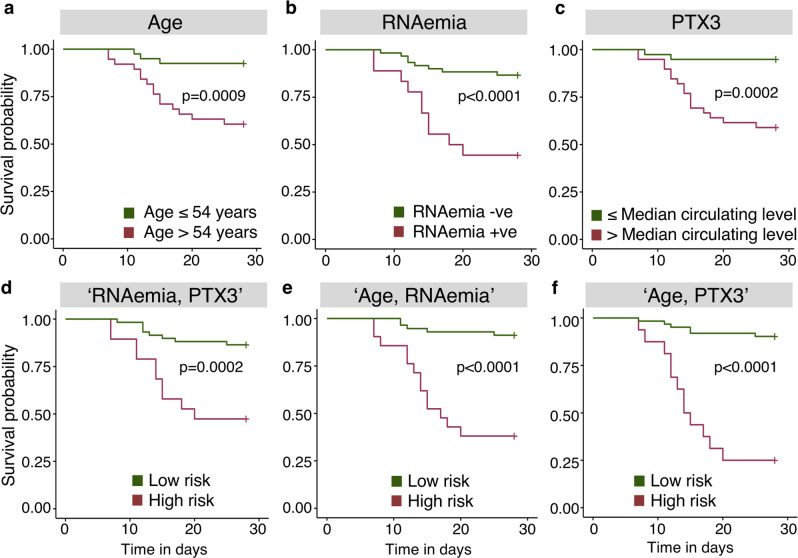
Fig. 5. SARS-CoV-2 mortality prediction using machine learning.
a Kaplan–Meier plot for age (using the median age of 54 years). b Kaplan–Meier plot for SARS-CoV-2 RNAemia. As a single predictor, RNAemia provides the best stratification for survival. c Kaplan–Meier plot for PTX3 using the median levels of serum or plasma. d–f Kaplan–Meier plots for “RNAemia, PTX3”, “Age, RNAemia”, and “Age, PTX3” combined using support vector machine with radial basis function kernel (SVM RBF), a non-linear machine learning model. The machine learning model selected binary combinations of “Age, RNAemia” and “Age, PTX3” as the best predictors. Kaplan–Meier analysis is two-tailed. Nonsurvivors: n = 18; survivors: n = 60.

