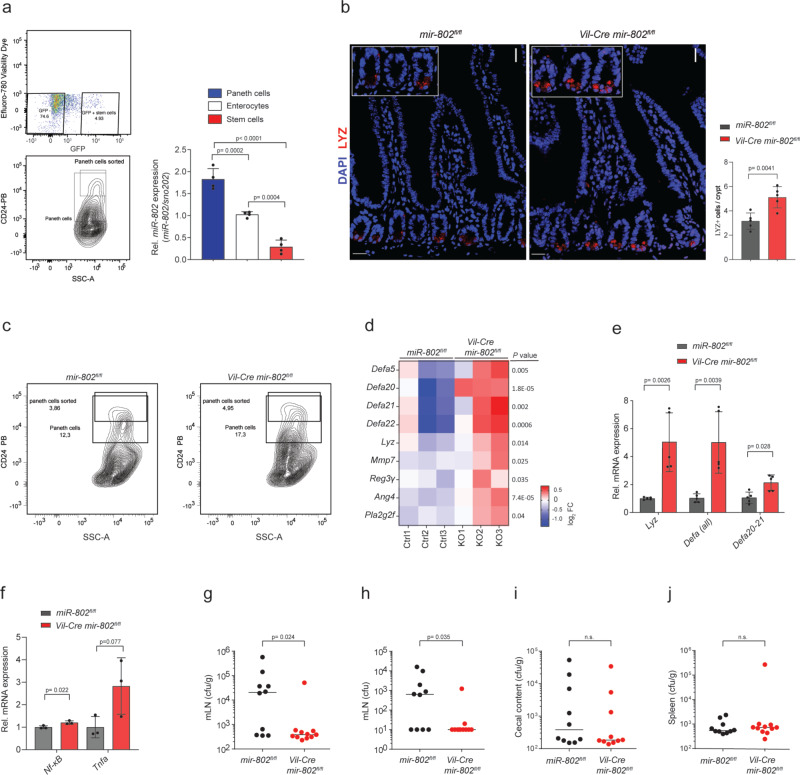
Fig. 2. miR-802 regulates intestinal Paneth cell expansion.
a FACS sorting of Paneth cells, intestinal stem cells (ISCs), and enterocytes from dissociated single cells of jejunal crypts and epithelium. ISCs were isolated as Lgr5-EGFP+, EPCAM+, CD24low/CD31−, Ter119−, CD45−, Efluoro780− and Paneth cells were sorted as CD24hi/SSChiLgr5-EGFP−, EPCAM+CD31‒, Ter119−, CD45−, Efluoro780− cells. An enriched enterocyte population was obtained by isolating remaining CD24− Lgr5-EGFP−, EPCAM+, CD31−, Ter119−, CD45−, Efluoro780− cells. Right: Relative miR-802 levels in Paneth cells, enterocytes, and stem cells as determined by qRT-PCR (n = 4 per group). Data representative of two independent experiments. b Immunohistochemistry of proximal jejunal sections of mir-802fl/fl and Vil-Cre mir-802fl/fl mice stained with anti-LYZ antibody. Top panel: Scale bar: 50 µm. Right: Quantification of Paneth cell numbers/crypt (n = 5 per genotype). Representative images and analysis of two independent experiments. c Percentage of sorted Paneth cells from single live cells from jejunal crypts of Vil-Cre mir-802fl/fl and control mice. Paneth cells were gated as CD24+, SSChi (n = 4 mice were pooled per genotype). Data representative of two independent experiments. d Heatmap showing mRNA expression, measured by RNA seq, of secreted proteins in Vil-Cre mir-802 fl/fl and control mice. Data are shown as Log2FC (n = 3). e, f Relative expression of Lyz and defensins (e) and NF-κB and TNFa (f), measured by qRT-PCR, in isolated enterocytes of Vil-Cre mir-802fl/fl and control mice (n = 5,5 for (e) and n = 3,3 for (f)). Data representative of two independent experiments (e) and one experiment (f). g–j Colonization experiment of 10-week-old pathogen-free mir-802fl/fl and Vil-Cre mir-802fl/fl mice that were gavaged with 108 CFU of stationary phase Salmonella Typhimurium (strain SL1344) cultures grown overnight. Bacterial levels in spleen, feces and mesenteric lymph nodes (mLNs) were determined by dilution plating of homogenized tissues. Colony formation unit per gram mLN (g), colony-forming units per mLN (h), colony-forming units per gram of cecal content (i), and colony formation unit per gram of spleen (j) (n = 10,11 for mir-802fl/fl and Vil-Cre mir-802fl/fl mice, respectively for (g, h, j) and n = 10 per genotype for (i), data are from two replicate experiments). Data are plotted as mean ± SD. Significance was evaluated by two-tailed t-test (b, e, f), one-way ANOVA with Tukey’s multiple comparisons test (a), or Mann–Whitney two-tailed test (g–j).

