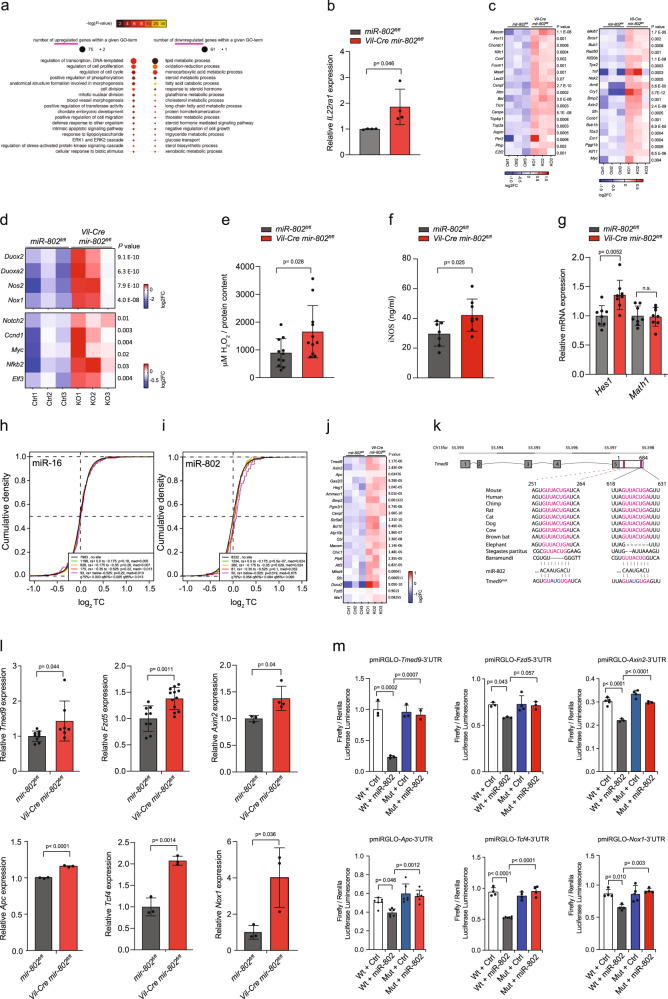
Fig. 4. Transcriptome analysis of isolated intestinal epithelial cells.
a GO plots from RNAseq data representing the upregulated (left) and downregulated biological processes (right). b Relative expression of IL22ra1, measured by qRT-PCR, in isolated crypts from upper jejunum (n = 4 per group, one experiment). c Heatmap of transcript expression from RNAseq data of positive regulators of the cell cycle (GO 0051726) shown as Log2FC (n = 3). d Heatmap of transcript expression from RNAseq data of ROS-producing genes (top) and Notch2 and downstream targets (bottom) shown as Log2FC (n = 3). e, f ROS (H2O2) (e) and iNOS (f) production in the upper jejunum of Vil-Cre mir-802fl/fl and mir-802fl/fl mice (n = 11 per genotype for ROS, two independent experiments) (n = 8, 7 per genotype for iNOS, respectively, one experiment). g Relative expression measured by qRT-PCR of Notch targets Hes1 and Math1 in isolated enterocytes of upper jejunum (n = 8 per genotype, one experiment). h, i Global miR-802 target gene regulation from RNAseq (n = 3 per group). Cumulative density blots of RNA-seq data for miR-802 (h) and miR-16 targets (i) (negative control), grouped by context score (cs+ based on Target Scan 7.1). j Heatmap from RNAseq data of 22 most differentially expressed target genes of miR-802 shown as Log2FC (n = 3). k Gene organization and evolutionary conservation of miR-802 target sites in 3′UTR of Tmed9. l Validation of indicated miR-802 target gene expression by qRT-PCR in isolated crypts of upper jejunum from Vil-Cre mir-802fl/fl and mir-802fl/fl mice. n = 9,9,3,3,3,3 for WT crypts, 7,12,4,3,3,3 for KO crypts, respectively, one experiment. m Dual-luciferase assays for miR-802 targets (Tmed9, Fzd5, Axin2, Apc, Tcf4, Nox1) in HEK293T transfected with plasmid-pmirGLO-WT 3′UTR (Wt) or plasmid-pmirGLO-mutant 3′-UTR, and miRNA mimics for miR-802 or control (Ctrl). Firefly luciferase activity was normalized to Renilla luciferase activity and expressed relative to control. n = 3,3,5,6,4,4 for Wt + Ctrl, 3,3,3,6,6,4 for Wt + miR-802, 3,4,4,6,4,4 for Mut + Ctrl and 2,3,3,6,4,4 for Mut + miR-802, one experiment. Data are plotted as mean ± SD. Significance was evaluated by a two-tailed t-test (b, e–g, l), or one-way ANOVA followed by Tukey’s multiple comparison test (m).

