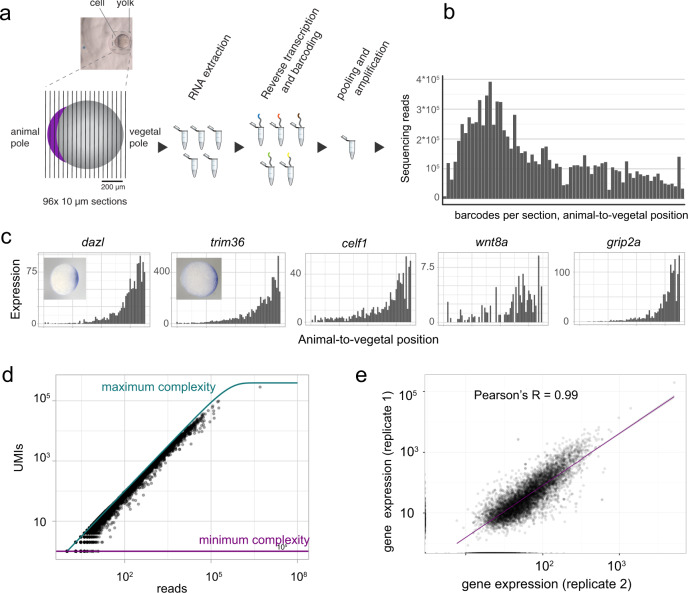
Fig. 1. Tomo-seq in one-cell stage embryos.
a Experimental outline: the embedded embryo is cryosectioned into 96 slices that are put into separate tubes. After adding spike-in control RNA, RNA is extracted. In a reverse transcription step, spatial barcodes are introduced. Samples are then pooled and amplified by in vitro transcription and a final library PCR. Scale bars are 200 µm. b Histogram shows raw transcript counts per section. c Tomo-seq tracks for the known vegetally localized genes dazl, trim36, celf1, wnt8a, and grip2a and whole-mount in situ hybridizations for dazl and trim36. d Sequencing depth, shown as UMI saturation per gene. Maximum complexity is determined as by Grün et al.73. e Correlation of two tomo-seq experiments (total counts summed over all sections). Line is a linear fit to the data. The difference in scale between the two axes is caused by differences in sequencing depth between the two replicates.

