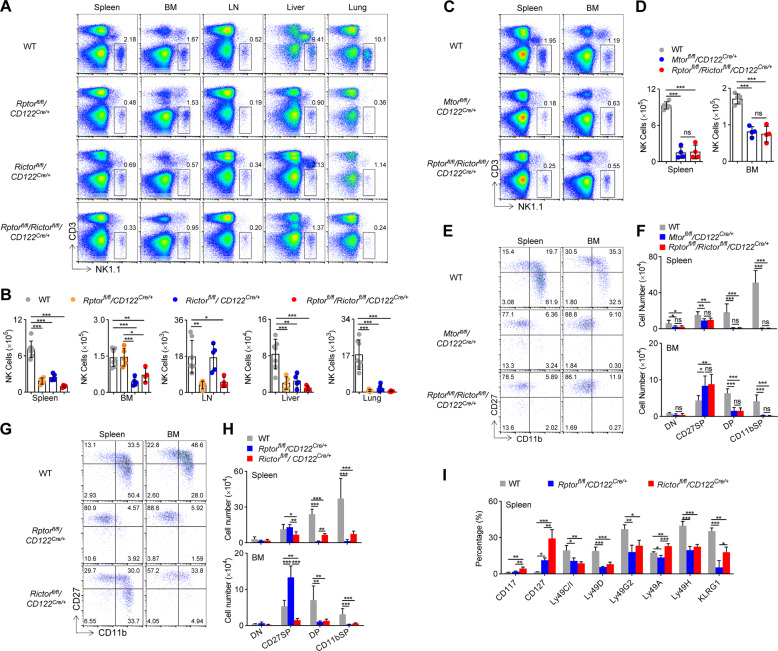
Fig. 4. mTORC1 and mTORC2 differentially dictate NK cell differentiation.
Representative flow cytometric profiles (A) and the absolute number (B) of NK cells (CD3−NK1.1+) in the spleen, bone marrow (BM), lymph nodes (LN), livers, and lungs of WT (n = 7), Rptorfl/fl/CD122Cre/+ (n = 5), Rictorfl/fl/CD122Cre/+ (n = 5), and Rptorfl/fl/Rictorfl/fl/CD122Cre/+ (n = 4) mice are illustrated. Representative flow cytometric profiles (C) and the absolute number (D) of NK cells (CD3−NK1.1+) in the spleen and bone marrow (BM) of WT (n = 5), Mtorfl/fl/CD122Cre/+ (n = 4), and Rptorfl/fl/Rictorfl/fl/CD122Cre/+ (n = 4) mice are illustrated. Representative flow cytometric profiles (E) and enumeration (F) of each subset of NK cell subsets on gated CD3−NK1.1+ splenocyte and bone marrow cells from the WT (n = 7), Mtorfl/fl/CD122Cre/+ (n = 6), and Rptorfl/fl/Rictorfl/fl/CD122Cre/+ (n = 6) mice are illustrated. Representative flow cytometric profiles (G) and enumeration (H) of NK cell subsets in the spleen and BM from the WT (n = 7), Rptorfl/fl/CD122Cre/+ (n = 6), and Rictorfl/fl/CD122Cre/+ (n = 6) mice are illustrated. I The percentages of development-related NK cell receptors on CD3−NK1.1+ cells in the spleen from the WT (n = 4), Rptorfl/fl/CD122Cre/+ (n = 3), and Rictorfl/fl/CD122Cre/+ (n = 3) mice are illustrated. DN (CD27−CD11b−), CD27 SP (CD27+CD11b−), DP (CD27+CD11b+), and CD11b SP (CD27−CD11b+) cells. For the bar graphs, each dot represents one mouse. The data represent at least three independent experiments, and one (D, I) or two-pooled (B, F, H) independent experiments are illustrated. Data are indicated as mean ± SD. Statistical significance was calculated using one-way ANOVA. *P < 0.05, **P < 0.01, and ***P < 0.001. ns not significant.

