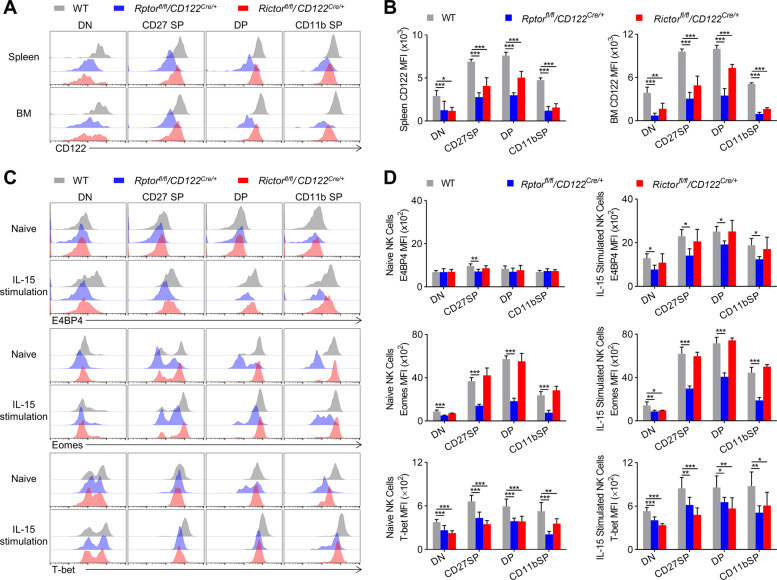
Fig. 5. mTORC1 and mTORC2 have different regulatory effects on E4BP4 and T-bet.
Representative overlaid histograms demonstrate CD122 expression level (A) by gated NK cells in the spleen and BM from WT (n = 6), Rptorfl/fl/CD122Cre/+ (n = 4), and Rictorfl/fl/CD122Cre/+ (n = 4) mice, and the MFIs were quantified (B). C, D Representative overlaid histograms indicate the E4BP4, Eomes, and T-bet expression levels of naive or IL-15 complex (50 ng/ml) stimulated NK cells in the spleen from WT, Rptorfl/fl/CD122Cre/+, and Rictorfl/fl/CD122Cre/+ mice (C), and the MFIs (D) (top panel, n = 3–5/genotype; middle panel, n = 3–6/genotype; bottom panel, n = 5–8/genotype). All data represent four independent experiments, and one ((B); top and middle panels of (D)) or two-pooled (bottom panel of (D)) independent experiments are illustrated. All data are indicated as mean ± SD. Statistical significance was calculated using one-way ANOVA. *P < 0.05, **P < 0.01, and ***P < 0.001.

