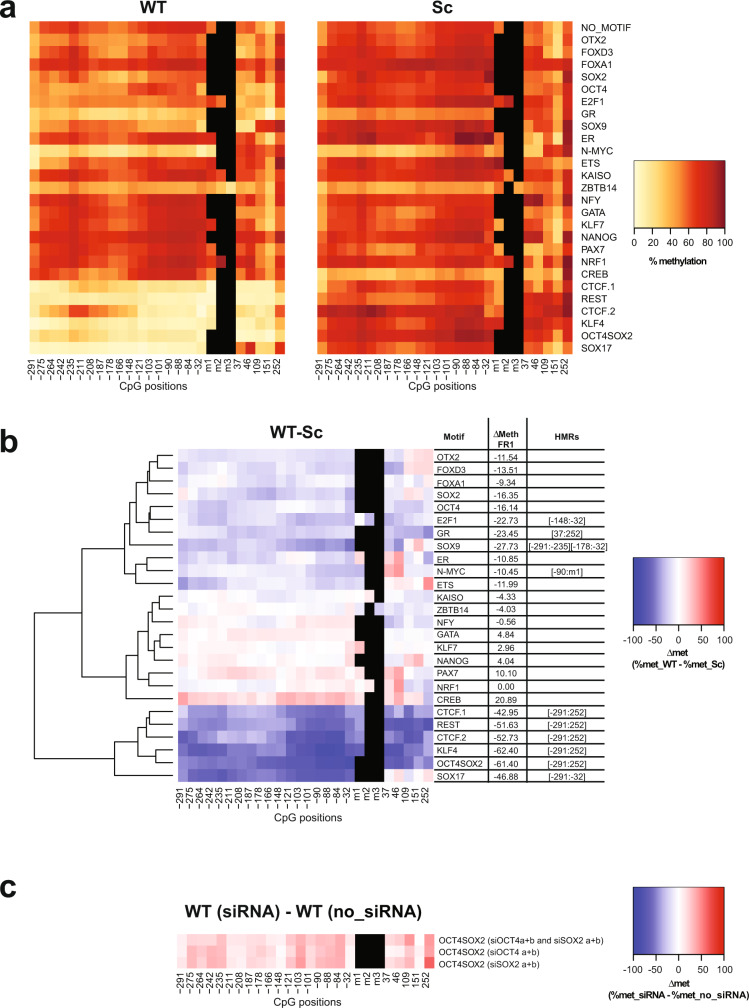
Fig. 3. Identification of super pioneer transcription factors (SPFs).
a Heatmaps indicating methylation percentages of individual CpGs in the FR1 containing WT (left panel) and Sc (right panel) motifs in the +SssI condition. Each line represents FR1 containing the indicated motif. Each square within the line corresponds to one CpG. The methylation percentage of individual CpGs is represented by a colour code. CpGs’ distance from the 5’ end of the motifs is indicated below the heatmaps. CpGs within the motif, when present, are indicated as m1, m2 and m3. b Differential methylation between WT and Sc motifs in the FR1/+SssI condition. Differential methylation was calculated for each CpG as Δmet = % met_WT − % met_Sc and represented by a colour code. Results were hierarchically clustered using the complete linkage method with Euclidian distance. CpGs’ distance from the 5’ end of the motifs is indicated below the heatmaps. The coordinates of statistically significant hypomethylated regions (HMRs) in WT condition are indicated on the side. c Differential methylation around OCT4SOX2 WT motif in the FR1/+SssI condition between cells that underwent SOX2 and/or OCT4 knockdown (siRNA) and untransfected cells (no_siRNA). Differential methylation was calculated for each CpG as Δmet = % met_WT (siRNA) − % met_WT (no_siRNA) and represented by a colour code. CpGs’ distance from the 5’ end of the motifs is indicated below the heatmaps.

