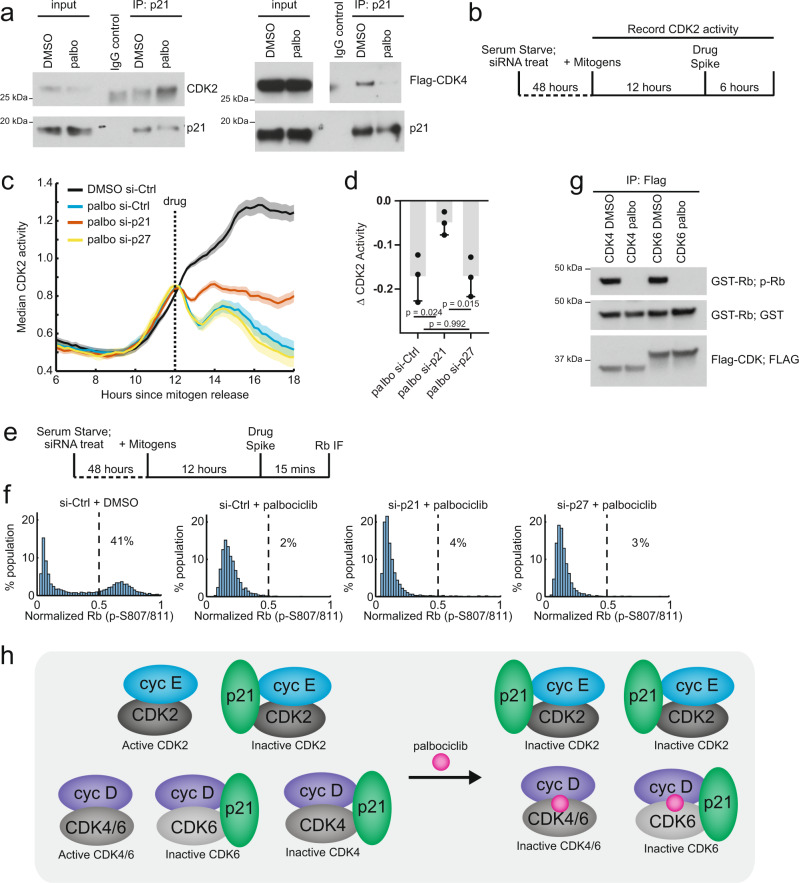
Fig. 4. Palbociclib inhibits CDK2 via a non-catalytic mechanism by redistribution of p21 from cyclin D-CDK4.
a MCF-10A cells stably expressing 3xFLAG-CDK4 where synchronized by serum starvation then stimulated with mitogens for 14 h prior to 30-min treatment with DMSO or palbociclib (6 µM). Immunoprecipitation of p21 was then performed and the amount of p21-bound CDK4 or CDK2 was determined by immunoblotting. b Schematic of the experimental protocol used to measure changes in CDK2 activity following palbociclib addition. Cells were serum starved and treated with the indicated siRNA immediately after initiating serum starvation and maintained in starvation media for 48 h. Cells were then stimulated with mitogens and live-cell imaging of CDK2 activity was performed. At the 12-h timepoint, DMSO or palbociclib was acutely added and imaging was continued. c Median live-cell CDK2 activity traces in mitogen-stimulated MCF-10A cells treated with indicated siRNA and DMSO or palbociclib (3 µM). Cells were selected for the analysis if they had CDK2 activity levels between 0.65 and 0.75 at the time of drug addition and if they had not yet entered S phase, as determined by FUCCI-APC/CCDH1 fluorescent reporter. Shaded areas indicate 95% confidence intervals. Data are from one experiment representative of three biological replicates. (DMSO si-Ctrl n = 281 cells, palbo si-Ctrl n = 173 cells, palbo si-p21 n = 207 cells, palbo si-p27 n = 103 cells). d Bar graph showing average drop in CDK2 activity following addition of palbociclib in si-Ctrl, si-p21, and si-p27 cells, comparing the difference in CDK2 activity at the time of drug spike and the average activity in the last hour of the time course. The results of three biological replicates are shown for each condition (mean ± s.d). One of the replicates is from data shown in (c). Replicate 1: DMSO si-Ctrl n = 281 cells, palbo si-Ctrl n = 173 cells, palbo si-p21 n = 207 cells, palbo si-p27 n = 103 cells; Replicate 2: DMSO si-Ctrl n = 119 cells, palbo si-Ctrl n = 124 cells, palbo si-p21 n = 156 cells, palbo si-p27 n = 174 cells Replicate 3: DMSO si-Ctrl n = 99 cells, palbo si-Ctrl n = 47 cells, palbo si-p21 n = 546 cells, palbo si-p27 n = 73 cells. Statistical analysis via a two-tailed unpaired Student’s t-test. e Experimental schematic for measuring acute loss of Rb hyper-phosphorylation upon palbociclib addition. Cells prepared as in (b), but cells were fixed 15 min after drug addition and Rb hyper-phosphorylation analyzed by immunofluorescence. f Histogram of Rb (phospho-S807/811) over the total Rb (phosphosite-independent antibody) immunofluorescence. Cells were gated for those with CDK2 activity <0.6 and no S-phase entry, as determined by FUCCI APC/CCDH1 fluorescent reporter. For each cell, nuclear intensity of p-S807/811 Rb and total Rb was measured and a ratio of the intensities was calculated. Cells were then normalized to the maximum single-cell ratio and plotted. Percentage of cells with a ratio greater than 0.5, representing cells with hyper-phosphorylated Rb, was calculated for each condition. DMSO si-Ctrl n = 5204 cells, palbo si-Ctrl n = 4252 cells, palbo si-p21 n = 4176 cells, palbo si-p27 n = 4345 cells. Plotted data are representative of three biological replicates. g IP kinase assay of immunoprecipitated 3xFLAG-CDK4 or 3xFLAG-CDK6 complexes towards GST-Rb (C terminus). CDK4 or CDK6-mediated phosphorylation of Rb (807/811) was assessed in the presence of DMSO control or palbociclib (6 µM) for 30 min. h Model of the catalytic and non-catalytic mechanisms how clinical CDK4/6 inhibitors inhibit CDK4/6 and CDK2 activity, respectively. In palbociclib treated conditions, active CDK4/6 complexes are catalytically inhibited by binding palbociclib while cyclin E-CDK2 complexes are non-catalytically inhibited by the transfer of p21 from cyclin D-CDK4-p21 to cyclin E-CDK2 as a result of the palbociclib mediated selective destabilization of cyclin D-CDK4-p21. Source data are provided as a Source data file.

