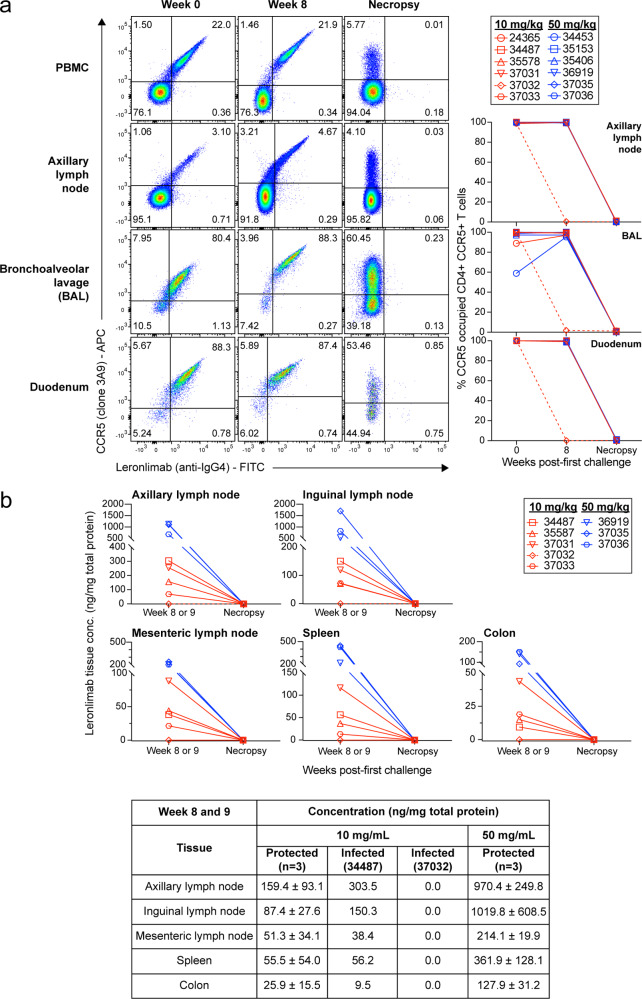
Fig. 3. Longitudinal Leronlimab tissue levels and CCR5 receptor occupancy.
Showing 10 mg/kg treated animals (red) and 50 mg/kg treated animals (blue). a On the left, representative flow cytometry plots showing the co-staining of anti-CCR5 (clone 3A9) and Leronlimab (by anti-human IgG4, clone HP-6025) on CD4+ T cells from PBMC, axillary lymph node, bronchoalveolar lavage, and duodenum. Tissues were taken from three timepoints: week 0 (one-week post first Leronlimab treatment; week of first viral challenge), week 8 (one-week post final Leronlimab treatment; one-week post final viral challenge), and necropsy (varying for all animals). Flow cytometry plots for all three timepoints and tissues followed the 50 mg/kg treated animal, 35153. On the right, individual CCR5 RO on longitudinal CD4+ CCR5+ T cells from axillary lymph node, bronchoalveolar lavage, and duodenum. Dashed line shows the CCR5 RO of 37032, the animal that developed ADA. b Tissue concentration of Leronlimab for five 10 mg/kg treated animals and three 50 mg/kg treated animals during two timepoints: week 8/9 and necropsy. On the bottom, summary of the tissue concentration in mean ( ± SD) values for the three protected 10 mg/kg treated animals; individual values for the infected 10 mg/kg treated animals, 34487, and 37032; and mean ( ± SD) values for the three protected 50 mg/kg treated animals. Group colors and individual animal symbols are consistent throughout the manuscript. Source data are provided as a Source Data file.

