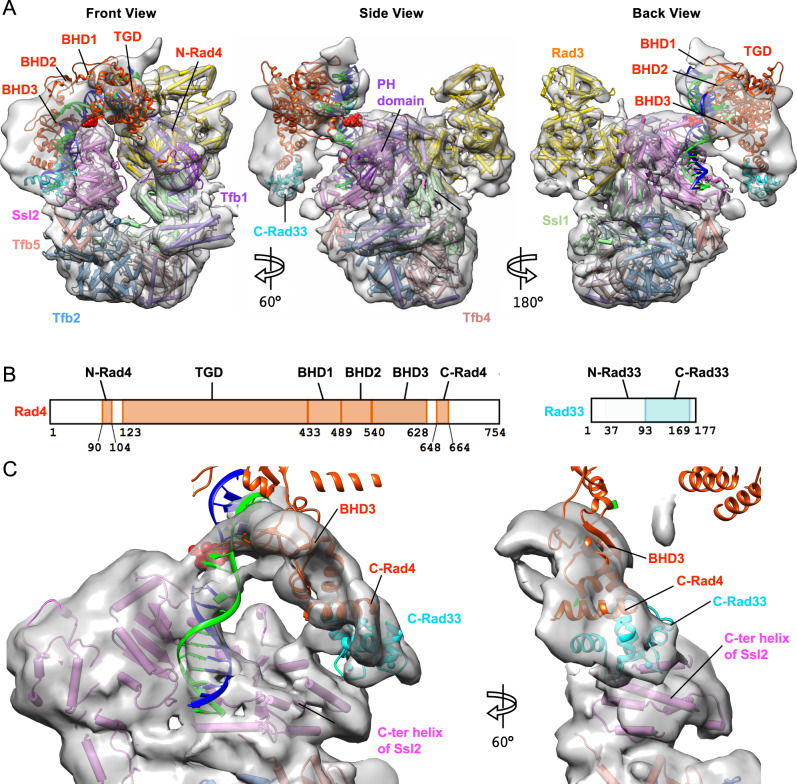
Fig. 4. Structure of TFIIH/Rad4–Rad23–Rad33/DNA complex.
A Composite cryo-EM map of Map 2 and Map 3 of TFIIH with Rad4–Rad23, seen in front (left), side (middle), and back (right) views. The crystal structure of Rad4-DNA complex (PDB:6CFI) was fitted into the density as a rigid body, with the lesion (6–4PP) in red sphere. Rad23 did not show corresponding density. B Schematic representation of domains of Rad4 and Rad33. Domains included in the model are colored. C 7.9 Å map (Map 3) refined by masking out TGD and BHD1-2. A homology model of Rad33 bound to C-Rad4 (PDB:2GGM) (cyan and orange red) was docked into a corresponding density, guided by cross-links of high confidence between C-Rad4 and the C-terminal region of Ssl2. The N-terminal half of Rad33 was not clearly seen. Seen in the back view.

