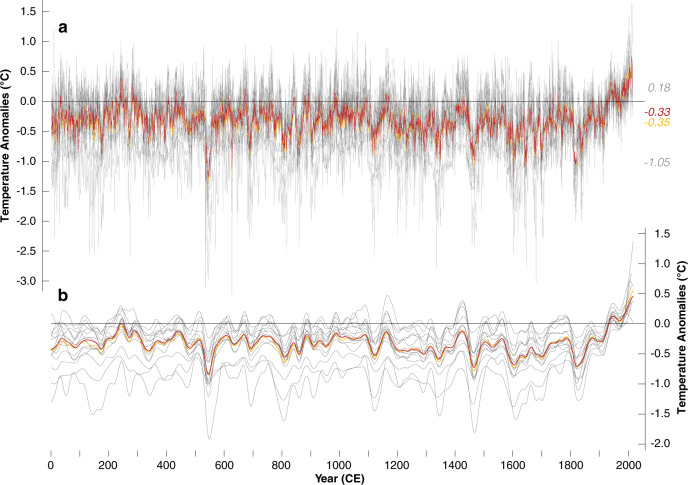
Fig. 4. Temperature reconstructions.
a Ensemble of 15 reconstructions (grey lines), together with their mean and median (orange and red). Numbers on the right refer to the long-term mean of the maximum, and minimum, as well as mean and median values between 1 and 2016 CE. The mean and median correlate significantly at 0.98 (p < 0.0001) and exhibit similar first-order autocorrelation coefficients of 0.71 and 0.70, respectively. b The 15 ensemble reconstructions and their mean and median after applying 50-year cubic smoothing spline functions.

