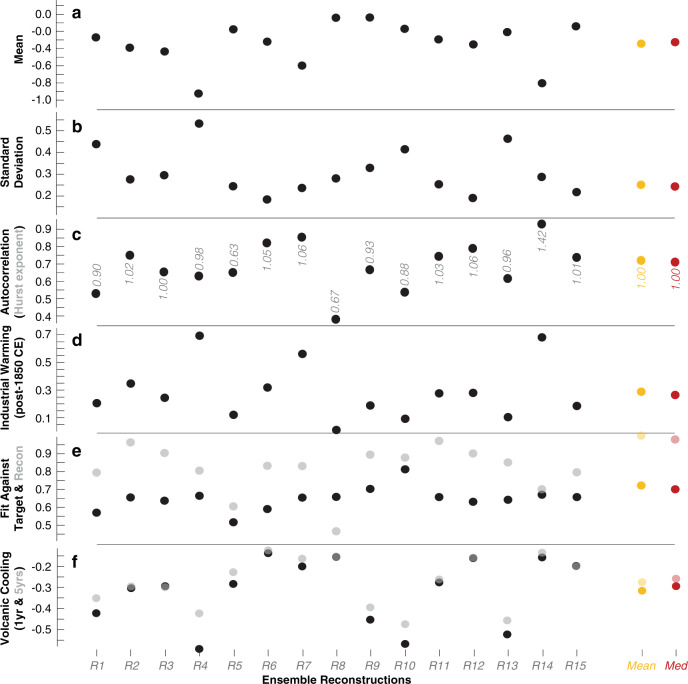
Fig. 5. Reconstruction characteristics.
a–d Mean, standard deviation, first-order autocorrelation (and highest Hurst exponent H), and the difference between industrial and pre-industrial temperature means (after and before 1850 CE) of the 15 ensemble reconstructions (R1–R15), as well as their mean and median (orange and red). e Correlation coefficients of the 15 ensemble reconstructions against the gridded instrumental target mean (Target Fit; black) and against the reconstruction mean (Recon Fit; opaque). f One (black) and 5-year (opaque) post-volcanic cooling relative to the 10 pre-eruption years (see Supplementary Fig. 3 for the 24 eruption years used). All statistics refer to 72–2000 (or 1794–2000 CE when considering the mean of the instrumental temperature records).

