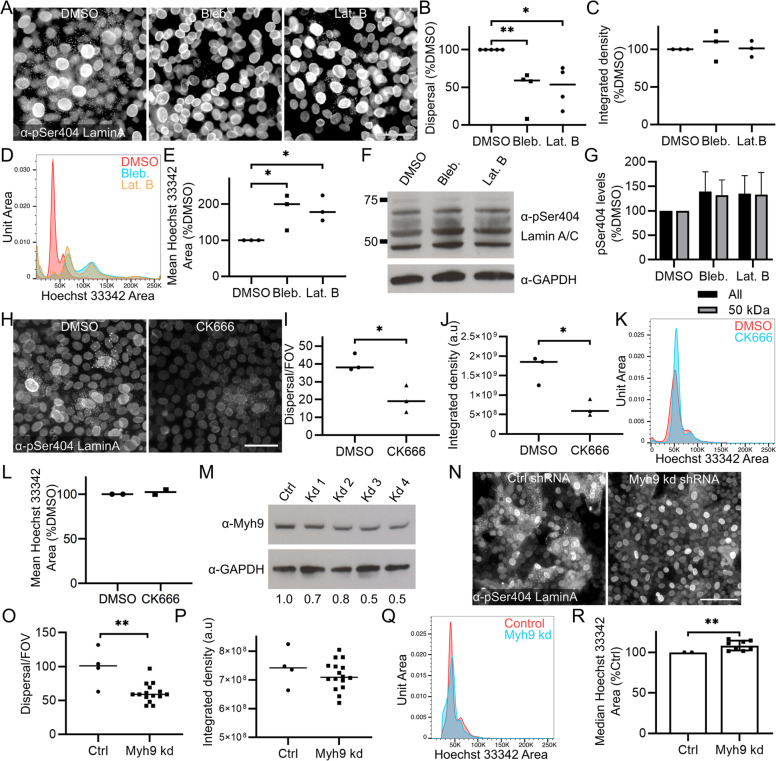
Fig. 5. Disruption of cytoskeletal Akt1 target protein function affects nuclear lamina dispersal and nuclear size.
A DMSO, blebbistatin and latrunculin B treated REKs stained for pSer404 Lamin A/C. Epifluorescence images, scale bar = 50 µm. B Number of cells with pSer404 Lamin A/C dispersal in DMSO, blebbistatin and latrunculin B treated REKs. % of DMSO control, >4 independent experiments, >3 FOV per experiment, one-way ANOVA *p ≤ 0.05, **p ≤ 0.01. C pSer404 Lamin A/C intensity in DMSO, blebbistatin and latrunculin B treated REKs. % of DMSO control, 3 independent experiments, >3 FOV per experiment, one-way ANOVA all comparisons non-significant. D Representative Hoechst 33342 Area of DMSO, blebbistatin and latrunculin B treated REKs. E Mean Hoechst 33342 Area of DMSO, blebbistatin and latrunculin B treated REKs. % of DMSO control, 3 independent experiments, one-way ANOVA, **p ≤ 0.01, ***p ≤ 0.001. F Representative pSer404 Lamin A immunoblots of DMSO, blebbistatin and latrunculin B treated REKs. G pSer404 Lamin A level of all fragments and the ~50 kDa fragment. % of DMSO, 2 independent experiments, all comparisons ns. H DMSO or CK666 treated REKs stained for pSer404 Lamin A/C. Epifluorescence images, scale bar = 50 µm. I Number of cells with pSer404 Lamin A/C dispersal in DMSO and CK666 treated REKs. 3 FOV, unpaired t-test *p ≤ 0.05. J pSer404 Lamin A/C staining intensity in DMSO and CK666 treated REKs. 3 FOV, unpaired t-test *p ≤ 0.05. K Representative Hoechst 33342 area of DMSO and CK666 treated REKs. L Median Hoechst 33342 area of DMSO and CK666 treated REKs. % of DMSO control, 2 independent experiments, non-significant. M Myh9 expression in Ctrl and Myh9 shRNA knockdown post-confluent REKs. Numbers are relative to GAPDH expression and normalised to Ctrl. N Ctrl and Myh9 shRNA knockdown post-confluent REKs stained for pSer404 Lamin A/C. Epifluorescence images, scale bar = 50 µm. O Number of cells with pSer404 Lamin A/C dispersal in Ctrl and Myh9 shRNA knockdown REKs. 4 independent shRNA knockdown cell lines, >3 FOV per line, Mann–Whitney test, **p ≤ 0.01. Representative of two independent experiments. P pSer404 Lamin A/C staining intensity in control and Myh9 shRNA knockdown cells. 4 independent shRNA knockdown cell lines, >3 FOV per line, Mann–Whitney test non-significant. Representative of two independent experiments. Q Representative Hoechst 33342 area of Ctrl and Myh9 shRNA knockdown REKs. R Median Hoechst 33342 area in Ctrl and Myh9 shRNA knockdown REKs. 2 independent experiments, 4 independent shRNA knockdown cell lines, error bars = SD, Wilcoxon test, **p ≤ 0.01.

