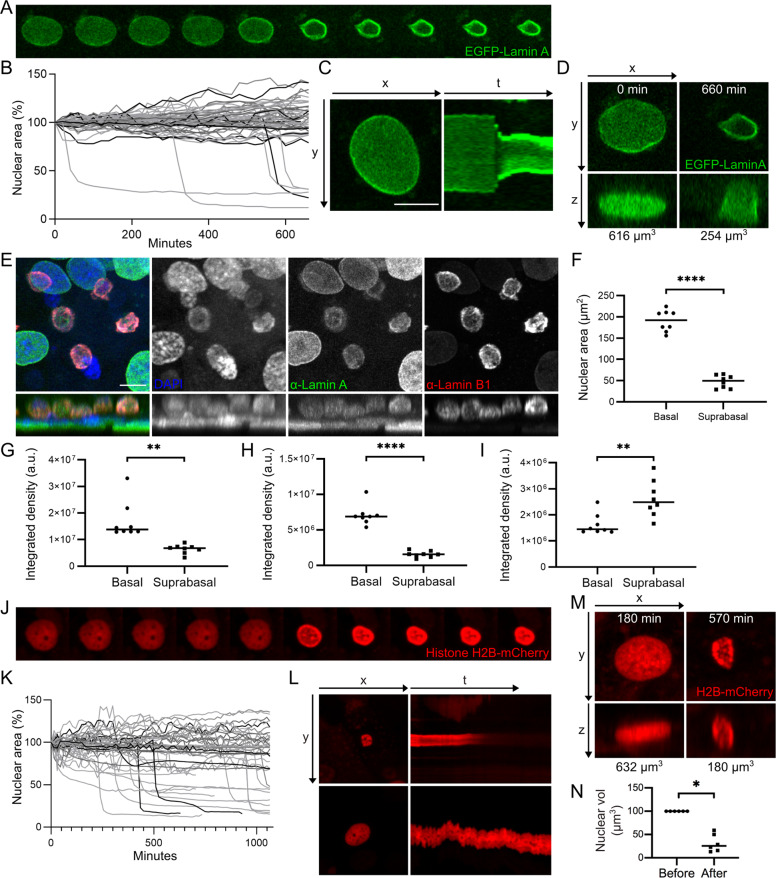
Fig. 6. Nuclear dynamics in differentiating REKs.
A Images every 20 min of EGFP-Lamin A positive post-confluent REKs. B Cross-sectional area EGFP-Lamin A positive nuclei over time. C Kymographs (yt projection) of a EGFP-Lamin A positive nucleus over time. D Xz projections of a EGFP-Lamin A positive nucleus. Labelled with nuclear volume. E Xy and xz projections of confocal z-sections of post-confluent REKs stained for Lamin A and Lamin B1. Scale bar = 10 µm. F Cross-sectional area of basal and suprabasal nuclei in post-confluent REKs. Two independent experiments, Welch’s t test, ****p ≤ 0.0001. Intensity of DAPI (G), Lamin A (H) and Lamin B1 (I) staining in basal and suprabasal nuclei in post-confluent REK cultures. Welch’s t test, **p ≤ 0.01, ****p ≤ 0.0001. Representative of two independent experiments. J Images every 15 min of Histone H2B-mCherry positive post-confluent REKs. K Cross-sectional area over time in 45 Histone H2B-mCherry positive nuclei greater than 80 µm2. L Kymograph (yt projection) of Histone H2B-mCherry over time; shrunken nucleus (top panels) and a nucleus that does not shrink (bottom panels). M Xz projections of Histone H2B-mCherry positive nuclei labelled with nuclear volume. N Histone H2B-mCherry positive nuclear volume before and after shrinkage. Wilcoxon test, *p ≤ 0.05.

