Figure 1.
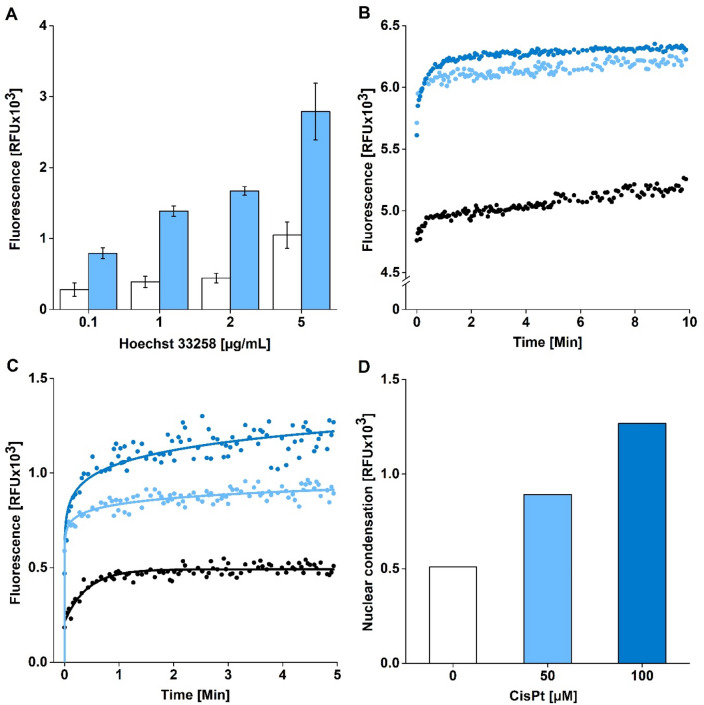
Optimization of the spectrofluorometric assay for detection of nuclear condensation and fragmentation in HepG2 cells. (A) Optimization of H33258 concentration (0.1; 1; 2; 5 µg/mL) – untreated cells (white columns), 100 µM cisplatin treated cells (blue columns). Mean ± SEM (n = 3). (B) Change of intensity of fluorescence over time. HepG2 cells were treated with CisPt for 24 h. Then, the cells were incubated with H33258 (2 µg/mL) and fluorescence (EX/EM = 352/461 nm) was recorded for 10 min. Untreated cells (black), 50 µM CisPt (light blue), 100 µM CisPt (dark blue). (C,D) Detection of nuclear condensation and fragmentation in cells. HepG2 cells were treated with cisplatin for 24 h. Then, the cells were incubated with H33258 (2 µg/mL) and fluorescence (EX/EM = 352/461 nm) was recorded for 5 min. Finally, the background fluorescence was subtracted and fluorescence intensity corresponding to the extent of nuclear condensation and fragmentation was showed in untreated (white), 50 µM (light blue) and 100 µM CisPt (dark blue) treated cells (= C). The fluorescence intensity attributed to the extent of nuclear condensation and fragmentation was compared among untreated cells (white), 50 µM CisPt (light blue), 100 µM CisPt (dark blue) treated cells (= D).

