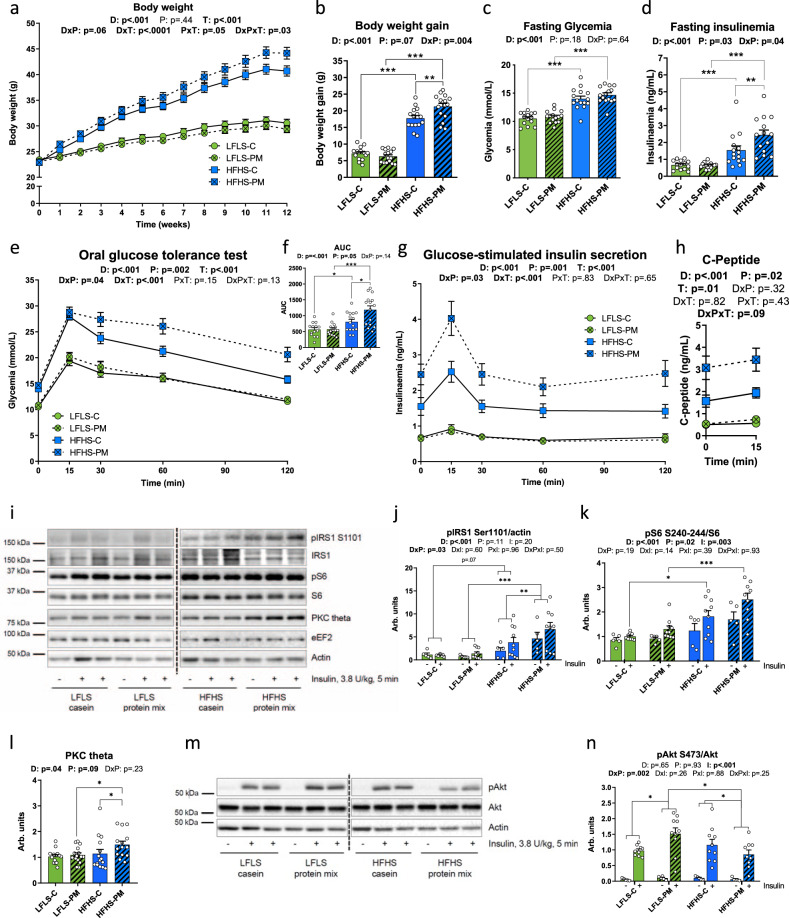
Fig. 2. Protein mix compared to casein potentiates diet-induced obesity and glucose intolerance through mTORC1 pathway activation in the liver.
Mice were fed with a LFLS-C (green), a LFLS-PM (green, hatched), a HFHS-C (blue), or a HFHS-PM (blue, hatched) diet. a Bodyweight curve and (b) total body weight gain over the 12 weeks of dietary treatment. c–h At week 11, mice were fasted for 6 h and challenged with an oral glucose load (1 mg/g body weight): (c) glycemia and (d) insulinemia before the ingestion of glucose, (e) glycemic response, and (f) area under the curve, as well as (g) insulinemic response following the glucose load. (n = 14 for LFLS-C group and n = 15 biologically independent mice for the three other groups except for (d) where n = 14 for HFHS-PM group). h C-peptide response before and 15 min after the ingestion of the bolus of glucose (n = 4 for LFLS-PM group, n = 6 for LFLS-C and HFHS-PM groups, and n = 7 biologically independent mice for HFHS-C group). i–n Hepatic insulin signaling of mice fasted for 6 h and injected intravenously with saline (“−“, n = 5 for all groups) or insulin (“+”, n = 9 for LFLS-C and HFHS-PM groups and n = 10 independent mice for LFLS-PM and HFHS-C groups) for 5 min before euthanasia: immunoblots and quantification of densitometry analyses for (i–k) pIRS1 Ser1101, total IRS1, pS6 S240-244 and total S6 (i, l) PKC theta (n = 14 for LFLS-C and HFHS-PM groups and n = 15 biologically independent mice for LFLS-PM and HFHS-C groups) and (m, n) pAkt Ser473 and total Akt. Actin and eEF2 have been used as loading controls. Representative images from different gels and separated by a dashed line. As twice as many mice were injected with insulin compared to saline, the number of representative animals (2:1) is pictured on the gels. Arb. units, Arbitrary Units. Data are represented as means ± s.e.m. Statistical analyses were performed using a two-way ANOVA, a three-way ANOVA or a mixed model for repeated measures, followed by a Tukey post-hoc test. P-values of general effect for diet (D), protein (P), time (T), and insulin condition (I) factors are recorded under the title of each graph, followed by the p-values of the corresponding factor interaction effects. Detailed significant differences detected by post-hoc test are recorded as follows: *p < 0.05, **p < 0.01, ***p < 0.001. Exact p-values for trends (0.05 ≤ p-value < 0.10) are recorded on graphs for an additional indication. See also Supplementary Figs. 1 and 2.

