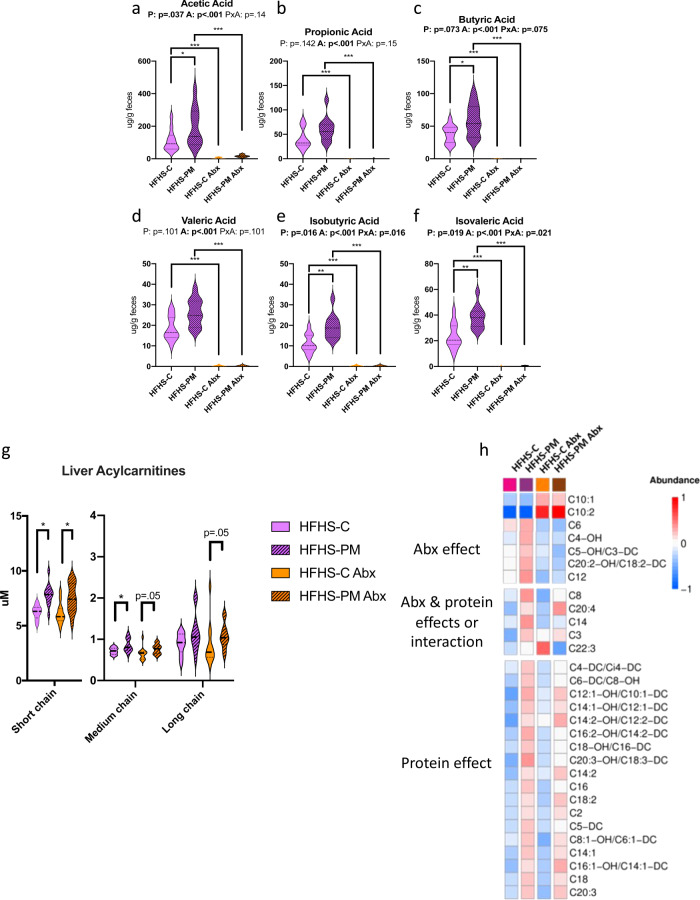
Fig. 6. Antibiotics (Abx) prevent SCFA and BCFA production while mitigating diet impact on hepatic acylcarnitines.
Mice were fed with a HFHS-C (purple) or a HFHS-PM (purple, hatched) and administered with an antibiotic cocktail (orange, and orange, hatched, respectively). Fecal levels of major SCFA (a) acetic, (b) propionic, and (c) butyric acid, and minor SCFA (d) valeric, (e) isobutyric, and (f) isovaleric acid after 2 weeks of dietary intervention. Hepatic (g) acylcarnitine profile and specific (h) acylcarnitine changes attributed to antibiotic treatment, protein source, or both. Short-chain AC: C2 to C4; Medium-chain AC: C5 to C10; Long-chain AC: C12 to C22. Data are represented as median, interquartile range, minimum and maximum. Metabolite concentrations were log10 transformed and Pareto scaled before generating a heatmap. Statistical analyses were performed using a two-way ANOVA followed by a Tukey post-hoc test. n = 12 biologically independent mice for all groups. P-values of general effect for protein (P) and antibiotic (A) factors and protein × antibiotic (P × A) interaction are recorded under the title of each graph. Detailed significant differences detected by post-hoc test are recorded as follows: *p < 0.05, **p < 0.01, ***p < 0.001. Exact p-values for trends (0.05 ≤ p-value < 0.10) are recorded on graphs for an additional indication. See also Supplementary Figs. 7 and 8.

