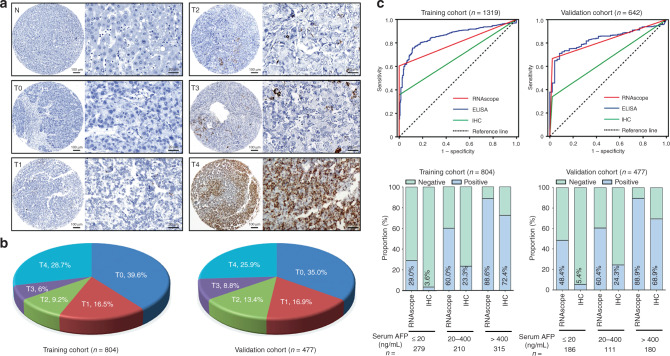
Fig. 2. Representative images for AFP RNAscope in paraffin-embedded HCC samples.
a AFP mRNA was detected by RNAscope in HCC (T) and non-tumourous tissues adjacent to HCC (N). Representative images for scores 0 (T0), 1 (T1), 2 (T2), 3 (T3), and 4 (T4) are shown. b Proportion of RNAscope score in HCC tissues in the training and validation cohorts. c The ROC curve for AFP detected by RNAscope (AUC = 0.802, p < 0.001 and AUC = 0.829, p < 0.001), ELISA (AUC = 0.861, p < 0.001 and AUC = 0.827, p < 0.001), and IHC (AUC = 0.678, p < 0.001 and AUC = 0.666, p < 0.001) for HCC vs. all other diseases including benign liver diseases and non-hepatocyte tumours in the training and validation cohorts. d The positive rates of AFP mRNA and AFP protein in HCC cases with different serum AFP levels are shown in the training and validation cohorts.

