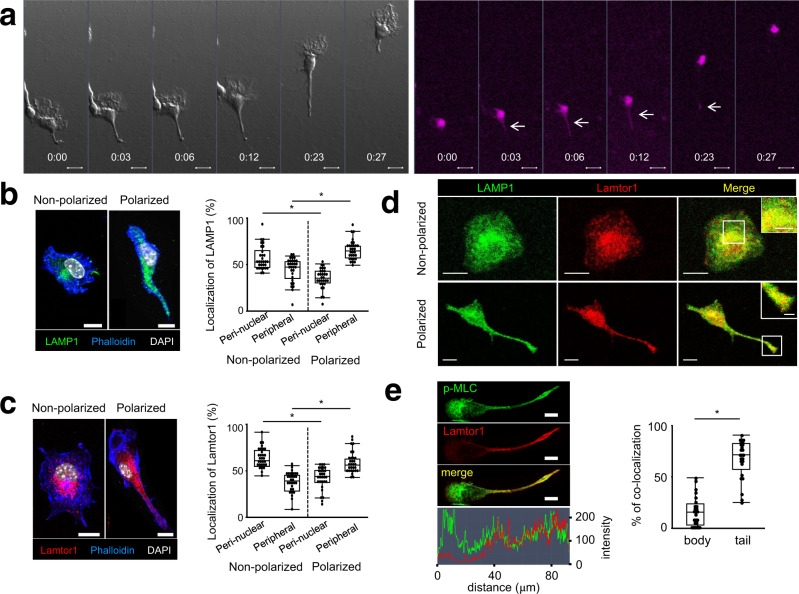
Fig. 1. Localization of the lysosome and Lamtor1 to the rear of migrating DCs.
a Localization of lysosomes during DC migration in a confined 3D environment. BMDCs were labeled with 1 μM AcidiFluor ORANGE and stimulated with LPS for 2 h. Movement of DCs (left) and AcidiFluor-positive lysosomes (magenta) in response to CCL19 (5 μg/ml) in type I collagen gel (2 mg/ml) in a Zigmond chamber were observed at 1-min intervals by time-lapse video imaging. b, c Localization of LAMP1+ lysosomes (b) and Lamtor1 (c) in non-polarized and polarized DCs. WT DCs were stained with anti-LAMP1 (green) (b), anti-Lamtor1 (red) (c), phalloidin (blue), and DAPI (white), and then visualized by confocal microscopy. Polarized and non-polarized cells were identified morphologically. Representative images are shown. Scale bar, 10 μm (left). The percentages of the ROI in the perinuclear and peripheral regions were determined (n = 30) (right). The perinuclear region was defined as the region within 5 μm of the nuclear membrane, and the peripheral region was defined as the region of the cell outside the perinuclear region. d Co-localization of Lamtor1 and LAMP1 in non-polarized (upper) and polarized (lower) DCs. DCs were stained with anti-Lamtor1 (red), anti-LAMP1 (green), and DAPI (white), and then visualized by confocal microscopy. Representative images are shown. Scale bar, 10 μm. Data are representative of three experiments. e Co-localization of Lamtor1 and phosphorylated MLC. Lamtor1 and phosphorylated MLC were visualized by staining in THP1 expressing Lamtor1-FLAG (red) with anti-p-MLC (green). Representative confocal images of polarized cells (left); scale bar, 10 μm (upper). Intensities of Lamtor1 (red) and p-MLC (green) (lower). Percentage of co-localization of Lamtor1 and p-MLC in body or tail region of polarized cells (n = 25 cells) (right). Data are representative of three experiments. Statistical analyses were performed by two-sided Steel–Dwass test (b, c) or Mann–Whitney U test (e) [median; 25th and 75th percentiles; and minimum and maximum of a population excluding outliers; *p < 0.0001].

