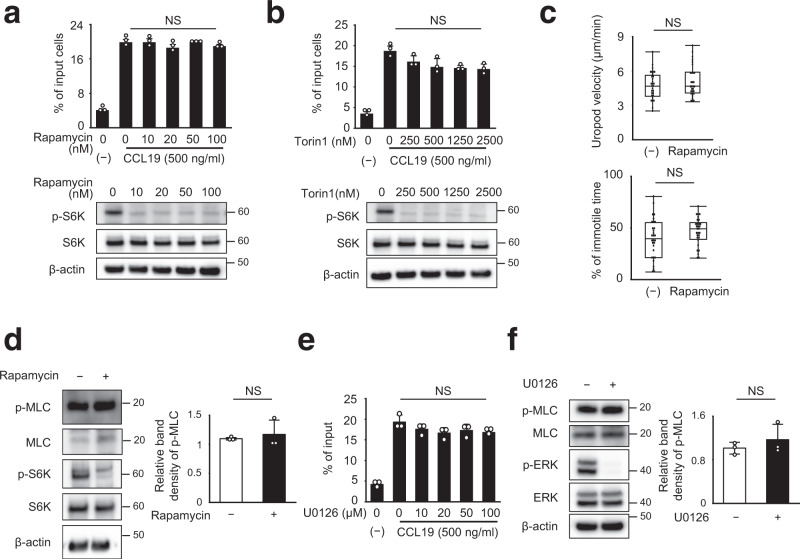
Fig. 3. mTOR inhibition does not affect DC migration.
a, b Chemotaxis of DCs treated with mTORC1 inhibitors in response to CCL19. Chemotaxis of WT BMDCs in response to CCL19 (500 ng/ml) in the presence of the indicated concentration of rapamycin (a) and torin1 (b), as determined by Transwell assay (pore size, 5 μm) (upper). Data are representative of three experiments (mean ± s.d.). Phosphorylation of S6K following treatment with rapamycin (a) and Torin1 (b) was determined by western blotting (lower). c DC migration in 3D collagen matrices in the presence of rapamycin. Movement of WT BMDCs in response to CCL19 (5 μg/ml) in type I collagen gel (2 mg/ml) containing 10 nM rapamycin was observed by time-lapse video imaging, and the velocities of the uropod (upper) and the percentage of the immotile period of the uropod (lower) were analyzed using the ImageJ manual tracking software (n = 40). d MLC phosphorylation of DCs treated with rapamycin. MLC phosphorylation and S6K phosphorylation in the presence of 10 nM rapamycin was evaluated by western blotting with anti-p-MLC and anti-p-S6K antibody, respectively (left). Data are representative of three experiments. The concentration of p-MLC in SDS-PAGE gel bands was determined using ImageJ, and statistical analysis was performed (right) (n = 3). e Chemotaxis of U0126-treated DCs in response to CCL19. Chemotaxis of WT BMDCs in response to CCL19 (500 ng/ml) in the presence of the indicated concentration of U0126, a MEK inhibitor, as determined by Transwell assay (pore size, 5 μm) (upper). Data are representative of three experiments (mean ± s.d.). f MLC phosphorylation of DCs treated with U0126. MLC and ERK phosphorylation in the presence of 20 μM U0126 were determined by western blotting with anti-p-MLC and anti-p-ERK antibody (left). Data are representative of three experiments. The concentration of p-MLC in SDS–PAGE gel bands was determined using ImageJ, and statistical analysis was performed (right) (n = 3). Statistical analysis was performed by two-sided Student’s t-test (a, b, d–f) [means ± s.d.], and two-sided Mann–Whitney U test (c) [median; 25th and 75th percentiles; and minimum and a maximum of a population; NS not statistically significant].

