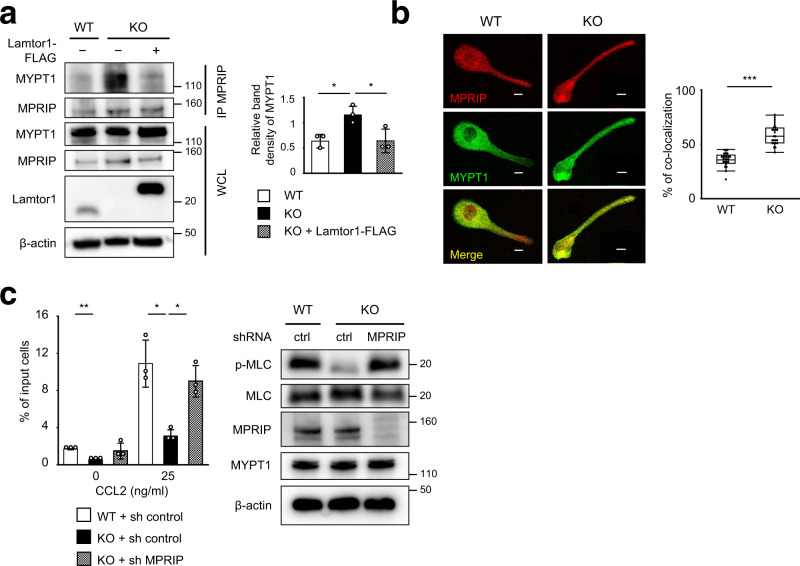
Fig. 5. Interacting of Lamtor1 with MPRIP interferes with the interaction between MPRIP and MYPT1.
a Interacting of MPRIP and MYPT1 in the presence or absence of Lamtor1. Parental THP1 cells (WT-THP1), Lamtor1-deficient THP1 (Lamtor1-KO-THP1), and Lamtor1-KO-THP1 cells in which full-length Lamtor1-FLAG was re-expressed (Lamtor1-KO-Full-THP1) were lysed, precipitated with anti-MPRIP antibody, and detected by western blotting with anti-MYPT1 and anti-MPRIP antibodies (left). Data are representative of three experiments. Concentration of MYPT1 co-precipitated with MPRIP in SDS–PAGE gel bands were determined using ImageJ, and statistical analysis was performed (right). b Co-localization of MPRIP and MYPT1. Localization of MPRIP and MYPT1 in WT and Lamtor1-KO-THP1 was evaluated by confocal microscopy using anti-MPRIP and anti-MYPT1 antibodies. A representative image of MYPT1 (green) and MPRIP (red) in a polarized cell is shown. Scale bar, 10 μm (left). Percentage of co-localization of MPRIP and MYPT1 in the tail region of polarized cells (n = 40) (right). c MLC phosphorylation and chemotaxis of MPRIP-knockdown THP1 cells. WT-THP1 or Lamtor1-KO-THP1 cells were transduced with control shRNA (WT-sh-ctrl-THP1, Lamtor1-KO-sh-ctrl-THP1) or MPRIP-shRNA (Lamtor1-KO-sh-MPRIP-THP1). Cells were lysed, and the levels of MPRIP, MYPT1, and MLC phosphorylation were detected by western blotting (right). Chemotaxis of WT-sh-ctrl-THP1 (white bar), Lamtor1-KO-sh-ctrl-THP1 (black bar), and Lamtor1-KO-sh-MPRIP-THP1 (mesh bar) in response to CCL2 (25 ng/ml) was evaluated by Transwell assay (pore size, 5 μm) (left). Data are representative of three experiments. Statistical analysis was performed by two-sided ANOVA with Tukey’s post hoc test (a, c) [means ± s.d.; *p < 0.05, **p < 0.01], or two-sided Mann–Whitney U test (b) [median; 25th and 75th percentiles; and minimum and maximum of a population excluding outliers; ***p < 0.0001].

