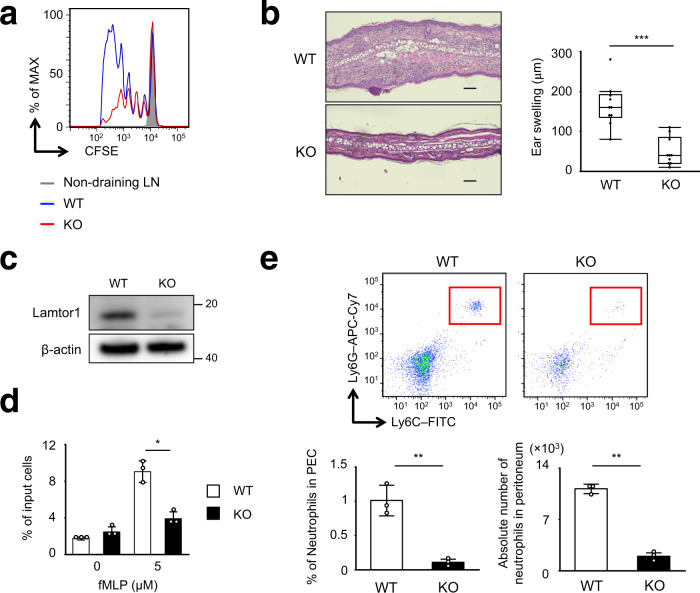
Fig. 9. Impaired in vivo T cell priming and neutrophil trafficking under Lamtor1 deficiency.
a In vivo OT-II T-cell proliferation following subcutaneous injection of OVA protein. After intravenous transfer of CFSE-labeled CD4+ OT-II T cells into WT (blue line) or CD11c–Lamtor1flox/flox (red line) recipient mice, OVA protein in complete Freund’s adjuvant was subcutaneously injected into the footpads of recipient mice. CFSE-dilution of OT-II T cells in popliteal LNs was analyzed by FACS. Data are representative of three independent experiments. b Hapten-induced contact hypersensitivity (CHS) in WT and CD11c–Lamtor1flox/flox mice. Five days after sensitization with DNFB in acetone, DNFB was applied to the ears. Forty-eight hours after the DNFB challenge, histological analysis (left) and evaluation of ear thickness (right) were performed (n = 10). Representative images are shown of WT (top) and CD11c–Lamtor1flox/flox (bottom) mice. Scale bar, 100 μm. c Lamtor1 expression in neutrophil of WT and LysM-Lamtor1flox/flox mice. Neutrophils isolated from BM from WT and LysM-Lamtor1flox/flox mice (KO) were lysed, and Lamtor1 expression was evaluated by western blotting. Data are representative of three experiments. d Chemotaxis of neutrophils in response to fMLP. Chemotaxis of WT (white bar) and Lamtor1–/– neutrophils (black bar) in response to fMLP (5 μM) was determined by Transwell assay (pore size, 3 μm). Data are representative of three experiments. e LPS-induced in vivo neutrophil mobilization. LPS was administered into the peritoneum of WT (WT, white bar) and LysM-Lamtor1flox/flox mice (KO, black bar). Six hours after administration, cells in the peritoneal cavity were isolated and stained for CD11b, Ly6C, and Ly6G, and the number of CD11b+Ly6G+ neutrophils (red rectangle) was counted by FACS (upper). Population (left) and absolute number (right) of CD11b+Ly6G+ neutrophils are shown (lower) (n = 3). Statistical analysis was performed by two-sided Student’s t-test (d, e) [means ± s.d.; *p < 0.05, **p < 0.01] or two-sided Mann–Whitney U-test (b) [median, 25th and 75th percentiles, and minimum and a maximum of a population excluding outliers; ***p < 0.001].

