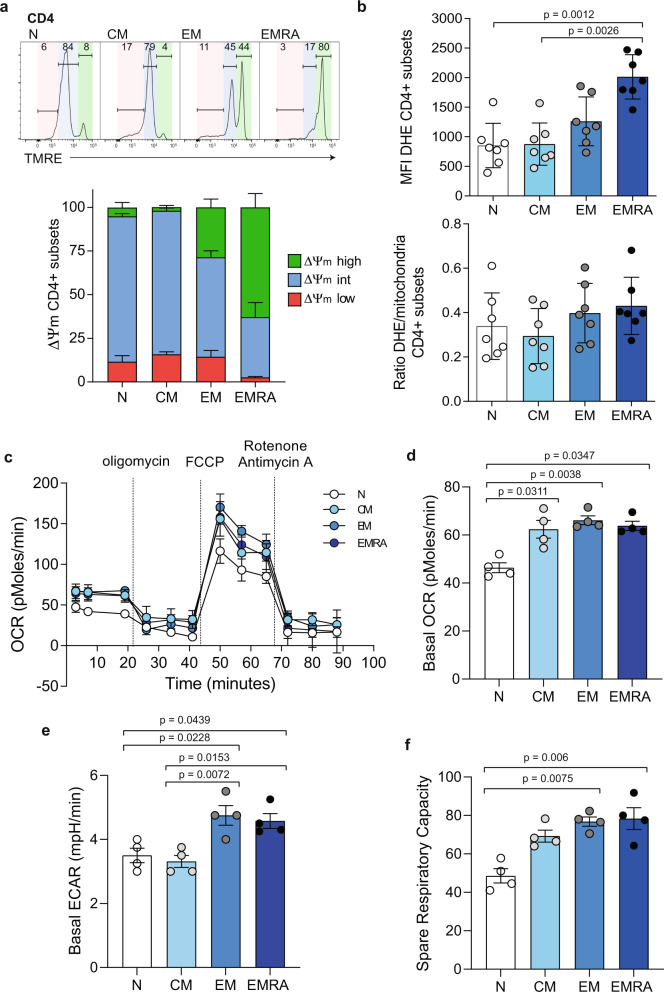
Fig. 2. CD4+ EMRA T cells have hyperpolarised mitochondria, but maintain normal T-cell metabolism.
a Mitochondrial membrane potential (MMP) was determined in CD27/CD45RA defined CD4+ T cell subsets using TMRE (n = 5 biologically independent samples). Low MMP = red, intermediate MMP = blue, high MMP = green. b ROS production was obtained using DHE in the CD27/CD45RA defined CD4+ T cell subsets (n = 7). c OCR of the CD4+ T cell subsets was measured after 15 min stimulation with 0.5 μg/ml anti-CD3 and 5 ng/ml IL-2, cells were subjected to a mitochondrial stress test using indicated mitochondrial inhibitors. Data are representative of four independent experiments. d Basal OCR, e Basal ECAR and f the SRC of the CD4+ T cell subsets after 15 min stimulation with 0.5 μg/ml anti-CD3 and 5 ng/ml IL-2 (n = 4 biologically independent samples). p values were calculated using a two-way Kruskal–Wallis test followed by Dunn multiple comparison for post hoc testing. Graphs show ± SEM.

