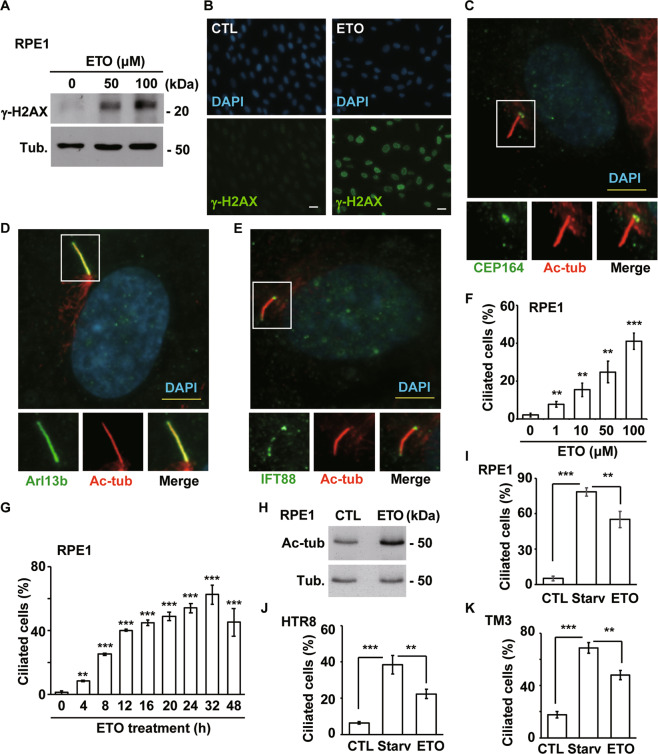
Fig. 1. Genotoxic stress induces ciliogenesis.
ETO treatment (50 and 100 μM, 24 h) induced DNA damage in RPE1 cells. A Extracts of RPE1 cells treated with or without ETO were analyzed by immunoblotting with antibodies against γ-H2AX and tubulin (Tub.). B γ-H2AX was detected by immunostaining with a specific antibody (green) in scramble control (CTL) or ETO-treated RPE1 cells. DNA was stained with DAPI (blue). Scale bar, 10 µm. ETO induced primary cilia formation in RPE1 cells. Double staining of ETO-treated cells with antibodies against (C) acetylated tubulin (Ac-tub, red) and CEP164 (green); D Ac-tub (red) and Arl13b (green); or E Ac-tub (red) and IFT88 (green). DNA was stained with DAPI (blue). Scale bar, 5 µm. F Quantitative results of the frequency of ciliated cells after treatment with different concentrations of ETO for 24 h. G Quantitative results of the frequency of ciliated cells after treatment with 100 µM ETO for different time periods. The results are presented as the mean ± SD of three independent experiments; more than 100 cells were counted in each individual group. H Ac-tub levels were increased in ETO-treated RPE1 cells. Extracts of RPE1 cells treated with or without ETO were analyzed by immunoblotting with antibodies against Ac-tub and Tub. Serum starvation (Starv) and ETO treatment induce ciliogenesis in RPE1 (I), HTR8 (J), and TM3 (K). **P < 0.01 and ***P < 0.001.

