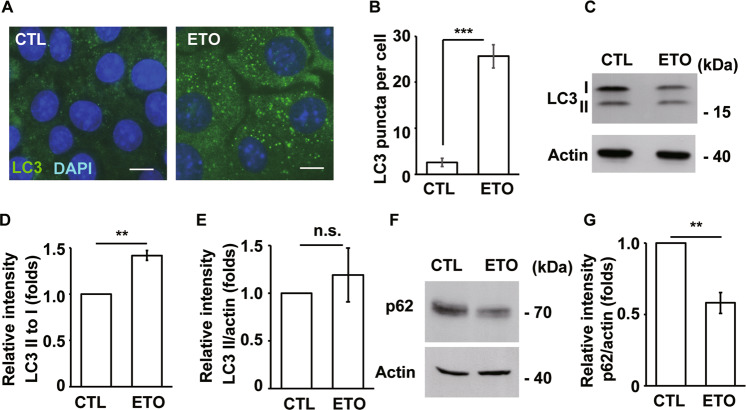
Fig. 5. ETO treatment activates autophagy.
A LC3 puncta were increased in ETO-treated RPE1 cells as shown by immunostaining with an antibody against LC3. DNA was stained with DAPI (blue). Scale bar, 10 µm. B Quantitative results of LC3 puncta per cell of RPE1 cells upon ETO treatment for 24 h. Increased LC3 II to I ratio in ETO-treated RPE1 cells. C Extracts of ETO-treated RPE1 cells were analyzed by immunoblotting with antibodies against LC3 and actin. Quantitative results of relative intensity of LC3 II/ I (D) and LC3 II/actin (E) of C. ETO-treated data were normalized to the data without ETO treatment. Reduced p62 abundance in ETO-treated RPE1 cells. F Extracts of ETO-treated RPE1 cells were analyzed by immunoblotting with antibodies against p62 and actin. G Quantitative results of relative intensity of p62 of F. **P < 0.01; ***P < 0.001; n.s. no significance.

