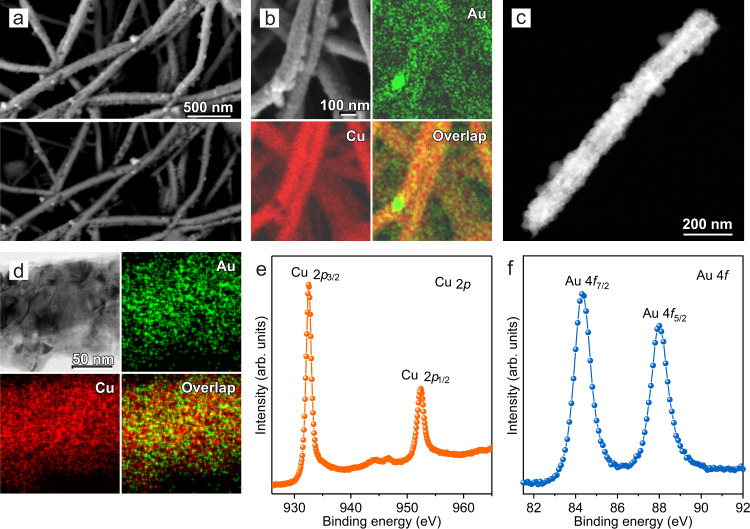
Fig. 2. Structural and compositional analyses of 7% Au–Cu catalysts on PTFE.
a Low magnification secondary electron image (above) and the corresponding backscattered electron image (below) of the 7% Au–Cu/PTFE, showing the dispersed Au nanoparticles (bright spots). b Secondary electron image and the corresponding EDX elemental mapping of Au and Cu for the 7% Au–Cu/PTFE. c High-angle annular dark-field scanning transmission electron microscopy (HAADF-STEM) image of one 7% Au–Cu/PTFE nanofiber. d High-magnification bright-field STEM image and the corresponding elemental mapping of Au and Cu from a section of one 7% Au–Cu/PTFE nanofiber. e, f High-resolution XPS spectra of Cu 2p (e) and Au 4f (f) for 7% Au–Cu/PTFE.

