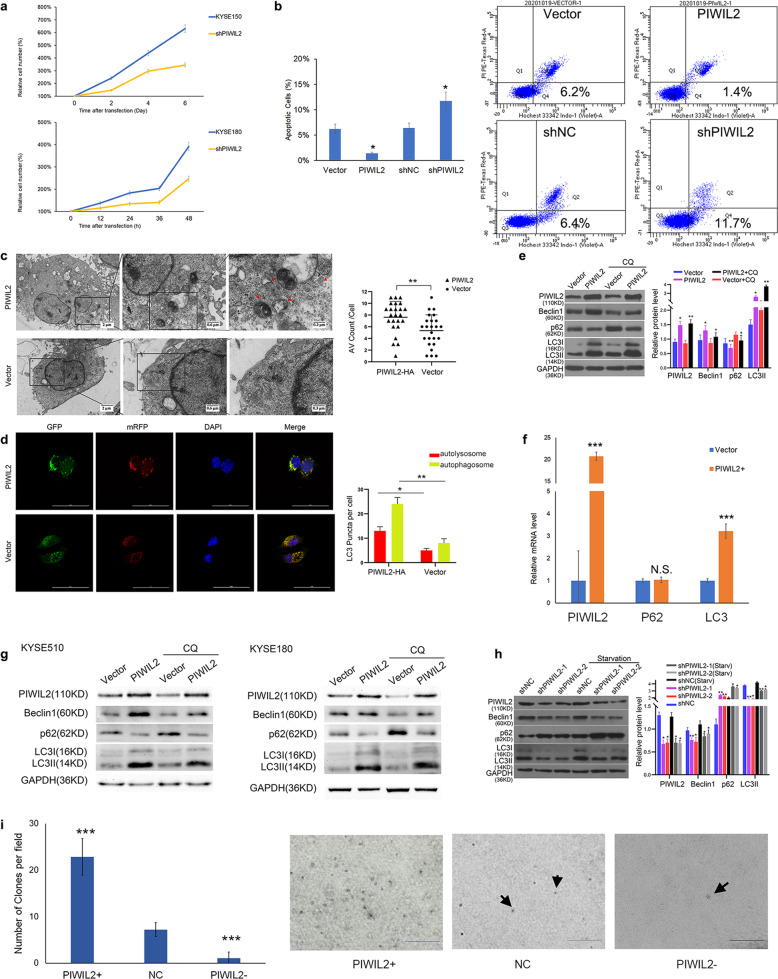
Fig. 2. PIWIL2 inhibited apoptosis, promoted cell proliferation, and activated autophagy.
a Proliferation rates of PIWIL2 knockdown stable KYSE150 cells (upper shPIWIL2) and transient transfected KYSE180 cells (lower shPIWIL2) were revealed by crystal violet assay. Mock-transfected cells were used as control. b At 24 h after transfection, KYSE150 cells were treated with serum starvation for 6 h. Starvation induced apoptosis was analyzed by flow cytometry with Hochest33342/PI double staining. Apoptosis(%) = percentage of Hochest+ve/PI-ve cells. c Electron microscopy images presenting ultrastructure in representative control (transfected with empty vector) and PIWIL2 overexpressed KYSE150 cells. Arrows show autophagic vacuoles (AV). The number of AV of 24 cells was counted in each section. d Control and PIWIL2 overexpressed KYSE150 cells were co-tranfected with Ad-mRFP-GFP-LC3B. The number of autolysosomes (red puncta) and autophagosomes (yellow puncta) of 24 cells was counted in each field. Scale bar, 50 µm. e KYSE150 cells were treated with 10 µM chloroquine (CQ) which inhibits the degradation of AV. LC3-II accumulation was measured using WB. f KYSE150 cells were subjected to RT-PCR at 48 h after transfection with PIWIL2 overexpression vectors (PIWIL2+) or empty vectors (Vector). Relative mRNA levels were normalized with GAPDH as internal control. g KYSE510 and KYSE180 cells were treated with 10 µM chloroquine (CQ) and subjected to WB analysis. h KYSE150 cells were starved to induce autophagy after transfected with shRNA against Piwil2 or control. Biomarkers of autophagy (LC3 and P62) were analyzed using WB. i Representative images of clone formation in soft agar for KYSE150 cells after transient transfection with PIWIL2 overexpression vector (PIWIL2+), PIWIL2 shRNA vector (PIWIL2−), and empty vector (NC). Scale bar, 0.5 mm. N.S., no significance; *p < 0.05; **p < 0.01; ***p < 0.001.

