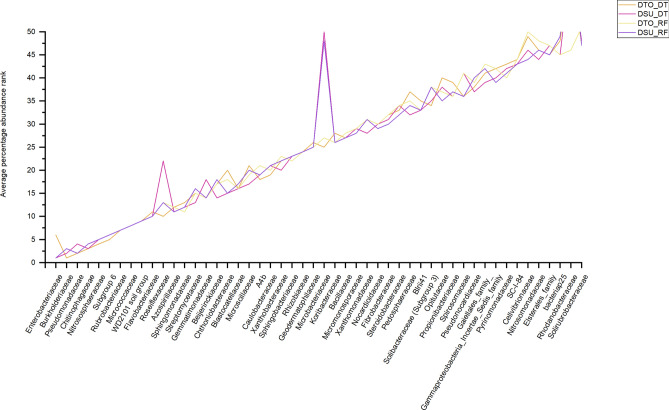
Figure 4.
Comparison of the average percentage abundance of bacterial families between the two wheat lines (DTO and DSU), under the two environmental conditions (DT and RF). Families were sorted from highest to lowest based on percent abundance and ranked from highest value (Rank 1) to 50th value (Rank 50) for wheat line (DTO and DSU) and environmental condition (DT and RF). The minimum rank value was taken across the four lines/conditions, and the columns sorted from lowest rank to highest rank, with the rankings plotted as a line graph.

