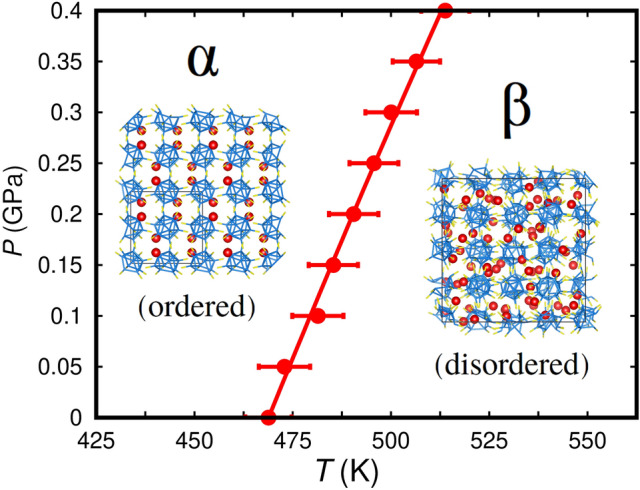
Figure 2.

Estimated LiBH phase diagram expressed as a function of pressure (P) and temperature (T). Results were obtained from classical molecular dynamics simulations performed with the LBH force field reported in work38. The coexistence line separating the stability region of the and phases, represented with a solid red line, was determined through a polynomial fit to the theoretical phase-transition data (solid red dots and error bars) and corresponds to the analytical expression , where the temperature and pressure are respectively expressed in units of K and GPa. Error bars represent statistical uncertainties estimated with time-average techniques (“Methods”).
