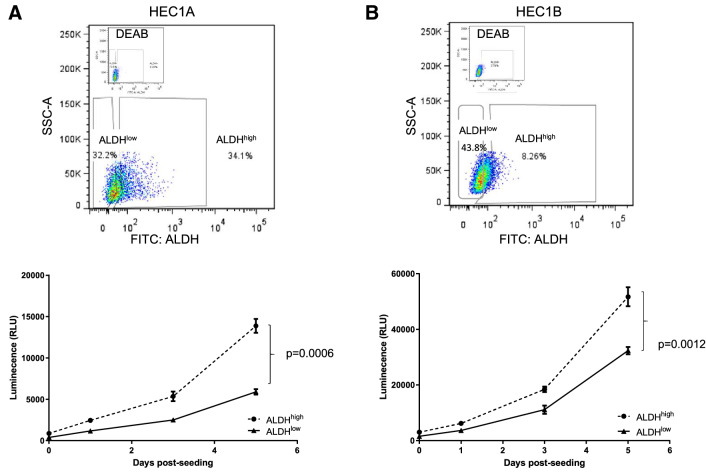
Figure 2.
ALDHhigh cells show enhanced proliferation. (A) Top, Flow diagram showing the gating of ALDHhigh and ALDHlow HEC1A cells. Bottom, The proliferation of sorted populations was evaluated over 5 days. Each sample was analyzed in triplicate with data shown as the mean ± SEM. The results shown are representative of three experiments. Two way ANOVA, p = 0.0006. (B) ALDHhigh and ALDHlow HEC1B cells were sorted as above (top panel), with cellular proliferation analyzed over 5 days (bottom panel). Each sample was analyzed in triplicate with data shown as the mean ± SEM. The results shown are representative of three experiments. Two-way ANOVA, p = 0.0012.

