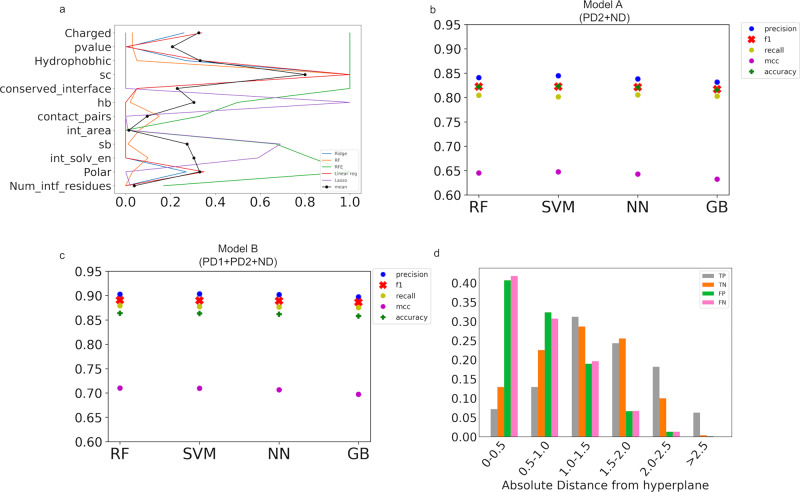
Fig. 2. Machine learning-based classifier to assess the quality of protein–protein interfaces.
a Importance of interface features in distinguishing the ‘native-like’ interface. The ranks calculated using different methods (Ridge, Random Forest (RF), Recursive feature elimination (RFE), Linear regression (Linear reg) and Lasso) were normalised between 0 and 1 and the mean feature rank is plotted in black. b, c Performance of different classifiers on the training dataset: RF (random forest), SVM (support vector machine), NN (neural networks), and GB (gradient boost) are used to perform supervised learning on the training dataset using stratified shuffle split as a means of cross-validation with ten splits. The performance is evaluated using accuracy, precision, F1, recall scores and Matthews correlation coefficient. Performance measures of Model A (b): trained on docking-derived positive dataset (PD2) and negative dataset (ND). Performance measures of Model B (c): trained using both high-resolution and docking-derived positive datasets (PD1 + PD2) and negative dataset (ND). d Fraction of true positives (TP), true negatives (TN), false positives (FP) and false negatives (FN) in different PI-score thresholds. The fractions (Y-axis) are averaged over the ten splits (stratified shuffle split) of the data. The different PI-score thresholds (X-axis) are indicated in absolute values.

