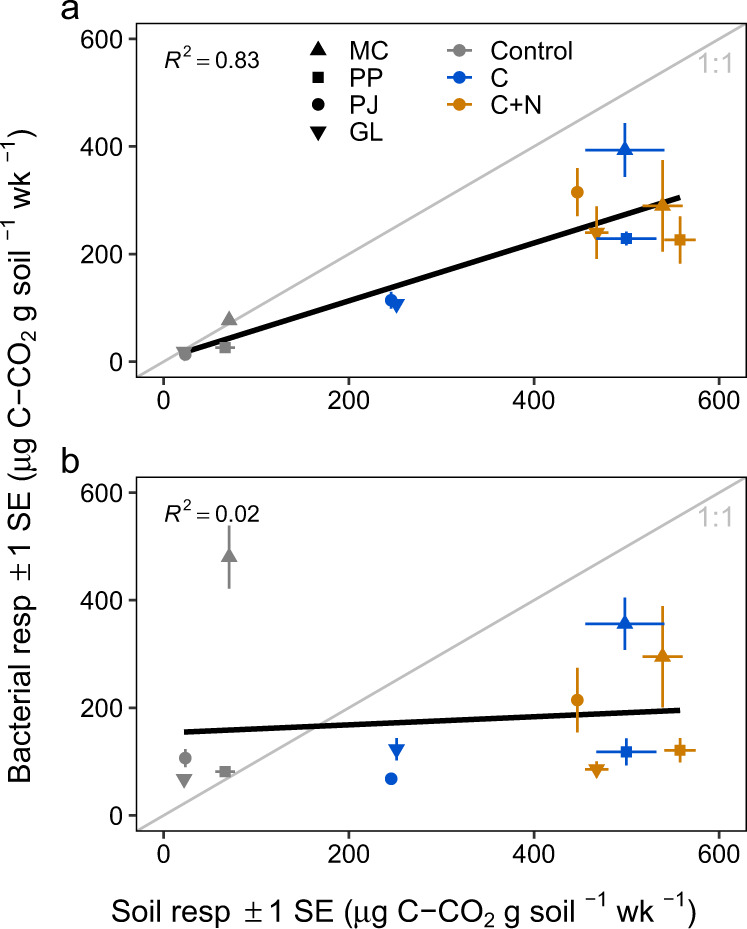
Fig. 1. Fit of modeled respiration scaled from taxon-specific isotopic enrichment against community soil respiration, by mass of carbon (C) per g dry soil per week (wk).

a Bacterial respiration is estimated as the sum of modeled taxon-specific respiration and plotted against measured soil respiration. b Bacterial respiration is estimated from the community-level enrichment of all 16S copies present in a sample (per g dry soil). Points show mean respiration values ± standard error (SE) across replicates (n = 3 experimental replicates) for each ecosystem (symbol MC mixed conifer forest, PP ponderosa pine forest, PJ piñon pine-juniper scrubland, GL desert grassland) and treatment (color control = no amendment, C = glucose, C + N = glucose and [NH4]2SO4).
