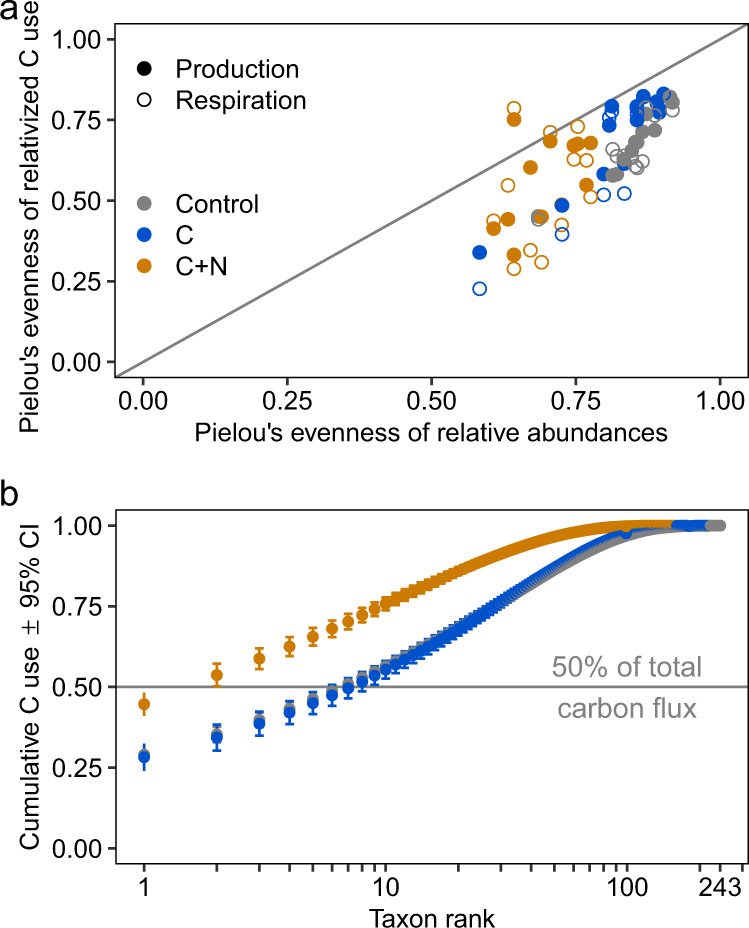
Fig. 3. Change in bacterial taxonomic and functional evenness across soil nutrient amendments.

Color indicates soil treatment (Control = no amendment, C = glucose, C + N = glucose and [NH4]2SO4). a Pielou’s evenness of bacteria by relative abundance against Pielou’s evenness by relativized carbon (C) use. Closed circles represent evenness of biomass production, open circles represent evenness respiration. b Cumulative contribution of bacteria to total relativized C use across soil amendment (n = 12 experimental replicates).
