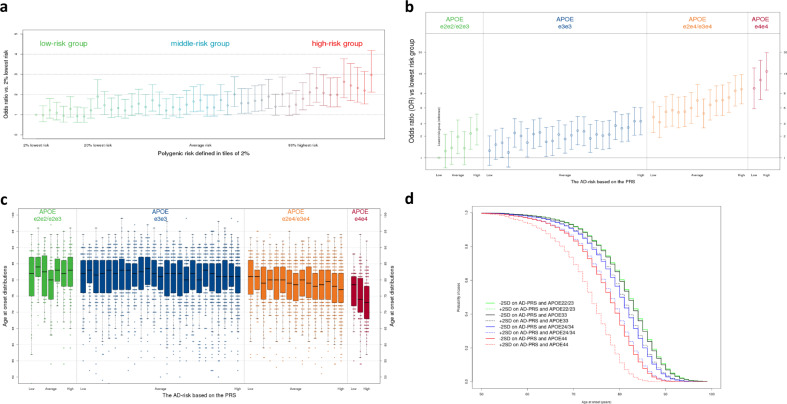
Fig. 5. Polygenic Risk Scores APOE stratification for AD in n = 12,386 biologically independent samples from GR@ACE/DEGESCO.
a The AD risk of PRS groups compared to those with the 2% lowest risk. The 2% highest risk had a 3.0-fold (95% CI [2.12–4.18], p = 3.2 × 10⁻¹⁰) increased risk compared with those with the 2% lowest risk. No interaction was found between the PRS and APOE genotypes (p value = 0.76). b The AD risk stratified by PRS and APOE risk groups compared to the lowest risk group (OR 95% CI). Association was found between highest and lowest-PRS percentiles within the APOE genotype groups: ɛ2ɛ2/ɛ2ɛ3 carriers (OR = 2.48 [1.51–4.08], p = 3.4 × 10⁻⁴), ɛ3ɛ3 carriers (OR = 2.67 [1.93–3.69], p = 3.5 × 10⁻⁹), ɛ2ɛ4/ɛ3ɛ4 carriers (OR = 2.47 [1.67–3.66], p = 6.8 × 10⁻⁶), and ɛ4ɛ4 carriers (OR = 2.02 [1.05–3.85], p = 3.4 × 10⁻²). Comparisons of the highest and lowest-PRS percentiles with respect to the APOE genotype groups: a difference was found between highest ɛ2ɛ2/ɛ2ɛ3 carriers vs. lowest ɛ3ɛ3 carriers (OR = 0.51 [0.34–0.75], p = 7.8 × 10⁻⁴), but not between highest ɛ3ɛ3 carriers vs. lowest ɛ2ɛ4/ɛ3ɛ4 carriers (OR = 1.17 [0.82–1.66], p = 0.40) and highest ɛ2ɛ4/ɛ3ɛ4 carriers vs. lowest ɛ4ɛ4 carriers (OR = 0.89 [0.52–1.53], p = 0.68). c The AAO of AD stratified by PRS and APOE risk groups. No difference in odds for AD was found between the PRS percentiles with AAO in APOE ɛ2ɛ2/ɛ2ɛ3 (lowest = 82 years, highest = 83 years, pWilcoxon = 0.39) and APOE ɛ3ɛ3 (lowest = 82 years, highest = 81 years, p = 0.16). However, a 4-year difference was found between APOE ɛ4 heterozygotes (pWilcoxon = 6.9 × 10⁻⁵, 81 years compared with 77 years) and 5.5 years difference (pWilcoxon = 4.6 × 10⁻⁵, 78.5 years compared with 73 years) in APOE ɛ4 homozygotes. Data are represented as boxplots as described in the manual of ggplot2 package in R. a–c Logistic regression models adjusted for four population ancestry components were used as statistical test. d Cox regression model on AAO. The determinants are the PRS and the APOE categories, a PRS*APOE interaction term and population substructure as covariates. The curve shows the probability a case in one of the eight groups has developed AD by a certain age (x-axis).

