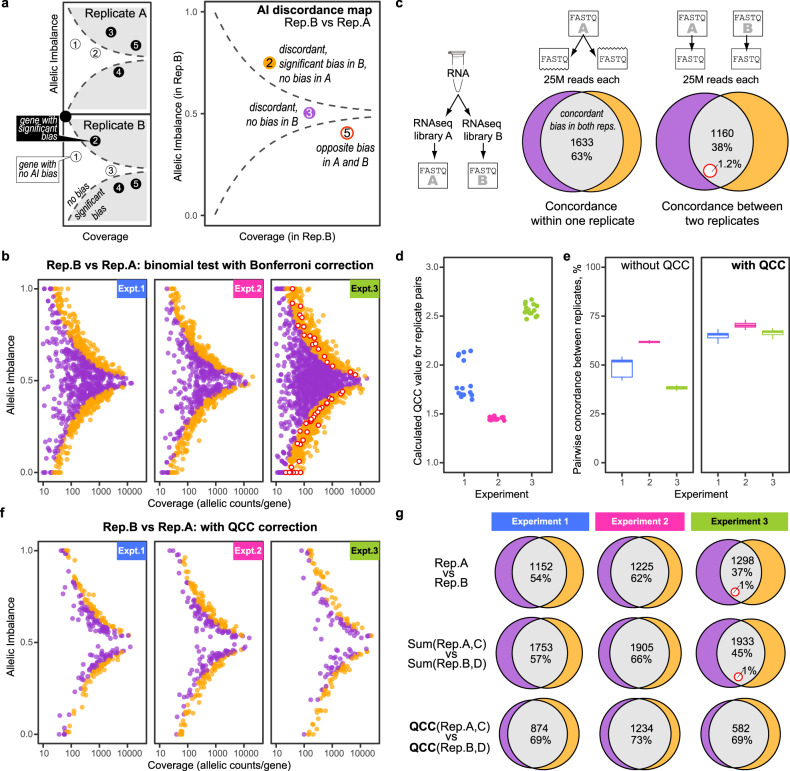
Fig. 2. Allelic imbalance values vary between technical replicate libraries and RNA-seq experiments.
a Explanation of AI discordance map. Type of discordance: orange–no bias in RNA-seq replicate A, bias in B; purple--no bias in B, bias in A; red/white circle--bias in both, in opposite directions. b AI discordance maps for representative pairs of technical replicates for three different experiments, all prepared from the same total RNA (see Methods and Supplementary Table S1). Significant bias: H0 of AI = 0.5 for each gene rejected by two-sided binomial test at p = 0.05 with Bonferroni correction. Colors as in (a). All comparisons, here and elsewhere, sample 30M uniquely mapped reads per replicate, unless noted otherwise. c Replicate RNA-seq libraries prepared from the same RNA compared to subsets of reads from the same library. Euler diagrams show genes with significant AI bias. Colors as in (a); percentages show fraction of all discordant genes. Data: RNA-seq from 129 × CastF1 mouse, replicates 1 and 2 from Experiment 3 (see Supplementary Table S1). d Quality Correction Coefficient (QCC), a measure of AI overdispersion defined in this work, calculated (see Fig. 3) for all 15 pairs of replicates within each of Experiments 1 (blue), 2 (red), or 3 (green). Notice general consistency of QCC values within experiments, and sensitivity to one outlier replicate in Experiment 1. e Fraction of concordantly biased genes [cf. grey area in (c)] for all 15 pairs of replicates within Experiments 1-3. Left: two-sided binomial test. Right: two-sided proportional test with QCC correction. Boxplot elements–center line: median; box: upper and lower quartiles; whiskers: 1.5 x interquartile range; points: outliers. f Same as (b), except H0 tested using proportional test with QCC correction. g Application of QCC increases concordance between replicates and between experiments. Colors as in (c). Top row: comparison of two individual replicates [replicates 2 and 3; Supplementary Table S1], 30M reads each; H0 test: two-sided binomial with Bonferroni correction. Middle and bottom rows: comparison of pooled pairs of replicates [replicates 2 + 4 vs 3 + 5; Supplementary Table S1], 30M reads per replicate. Middle: two-sided binomial test with Bonferroni correction. Bottom: two-sided proportional test with QCC correction.

