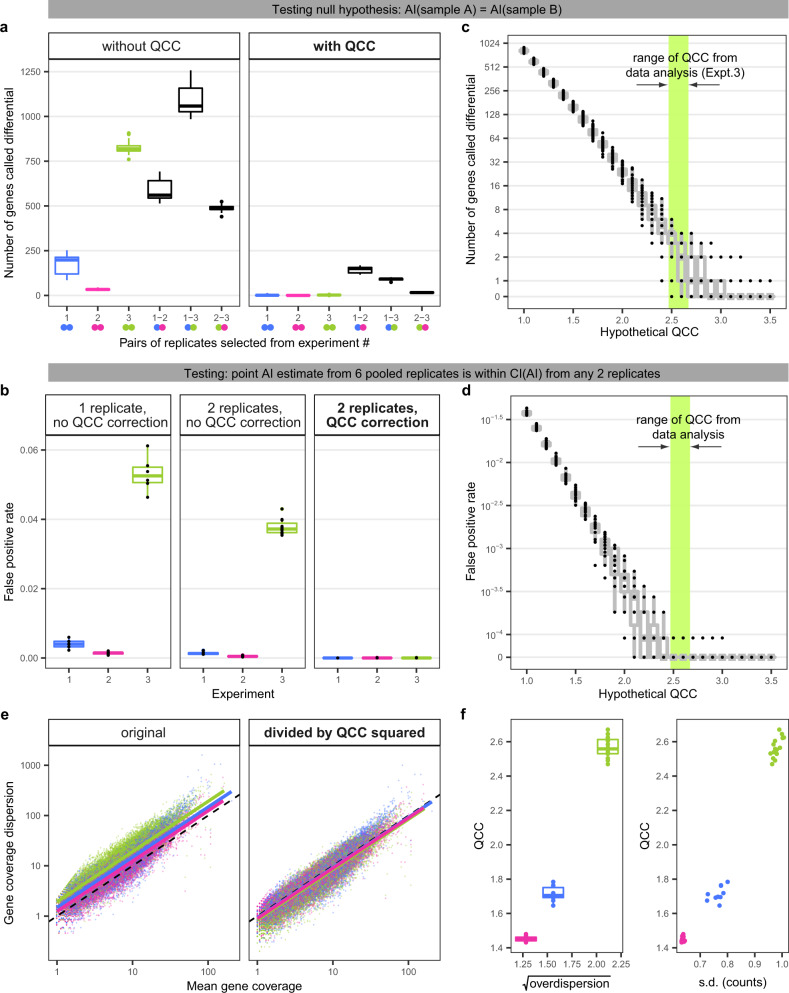
Fig. 4. QCC enables differential AI analysis and is correlated with abundance overdispersion.
a Number of genes with apparent differential AI in the same biological sample (false positives) before (left) and after QCC correction (right). Within each of three experiments, all 45 pairwise comparisons were performed. For comparisons between experiments, 45 sets of pairs were randomly chosen from 225 possible combinations. QCC values were calculated for each pair, and genes with significantly different AI in each set were identified. Experiments : 1 (blue), 2 (red), or 3 (green). Boxplot elements everywhere as in Fig. 2. Two-sided test was used here and in (b), (c), (d). b Impact of QCC on false positive (FP) rate. FPs are defined as genes for which the point AI estimate from all pooled replicates is not within CI from one replicate (left), two pooled replicates (center), and two replicates with QCC correction (right). Outlier from Experiment 1 (replicate 1) was removed from this analysis. All individual datapoints are shown in black. c, d Calculated QCC value (contained within the color bar) are close to optimal balance between FP and signal. c Number of FP genes (differential expression AI in the same biological sample) calculated for different potential values of QCC for all 45 possible combinations of two pairs of replicates from Experiment 3. d FP rate (as in (b)) for different possible QCC values calculated for all possible pairs of replicates in Experiment 3. a–d Note that the unit of comparison is composed of two technical replicates in both the binomial test and the QCC test. e Differences between experiments in abundance overdispersion are proportionate to QCC. Left: Abundance overdispersion for each experiment can be fitted as log-linear regression (solid lines) above expected Poisson dispersion (dotted line). Right: same after overdispersion was divided by QCC2. The outlier replicate from Experiment 1 was removed for (e) and (f). f Correlation of QCC and abundance overdispersion. QCC values are the same as in (e). Abundance overdispersion for each experiment calculated as exponent of intercept of log-linear regression (see (e)) between mean and dispersion of total counts: Left: for all replicates in an experiment; Right: for all possible pairs of replicates.

