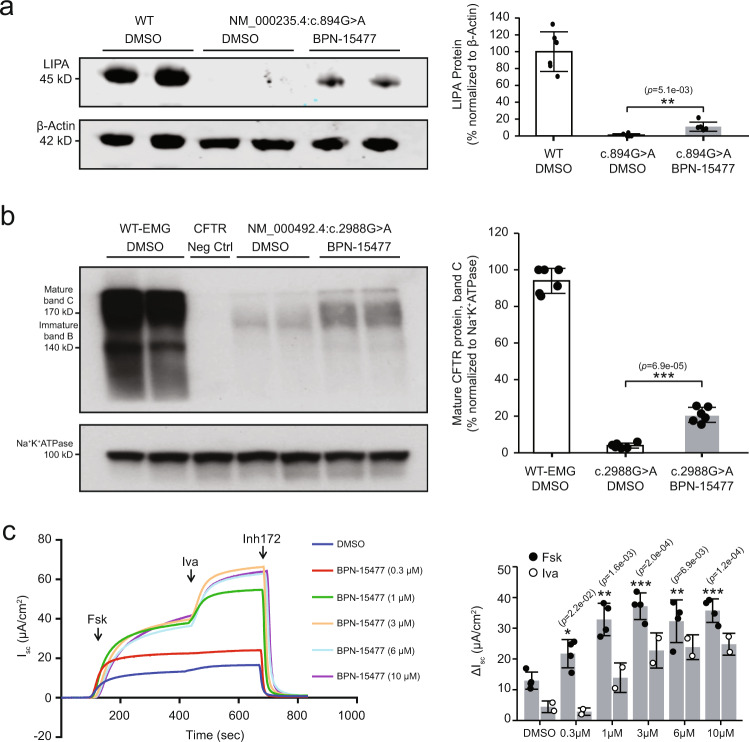
Fig. 5. BPN-15477 treatment increases LIPA and CFTR protein in disease-relevant cellular models.
a Western blot analysis of LIPA protein in patient fibroblasts carrying the c.894G > A mutation. Left: Top and bottom panels show the blot probed with anti-LIPA and anti-ß-Actin antibody, respectively. Right: Bar chart showing the densitometric analysis of the western blot expressed as percentage of WT. LIPA was normalized to ß-Actin. To generate the bar plot, the experiment was independently repeated six times (n = 6). b Western blot analysis of CFTR protein in 293-Flpin cells stably expressing WT-EMG-i14-i18 or c.2988G > A-EMG-i14-i18. 293-Flpin cells with no endogenous expression of CFTR protein served as negative control. Left: Top and bottom panels show the blot probed with anti-CFTR and anti-Na+K+ATPase antibody, respectively. Right: Bar plot showing the densitometric analysis of the western blot expressed as percentage of mature CFTR protein, band C. Amount of mature CFTR protein was normalized to Na+K+ATPase. To generate the bar plot, the experiment was independently repeated six times (n = 6). In (a) and (b), data are presented as mean values ±S.D. The statistical significance is determined via two-tailed Welch’s t-test. The unadjusted p values are displayed. c CFTR chloride channel analysis in CFBE-Flpin cells stably expressing c.2988G > A-EMG-i14-i18. Left: A representative tracing of short-circuit current (Isc) measurements recorded in Ussing chambers after treatment of cells with either DMSO (vehicle) or variable doses of BPN-15477 for 72 h, as indicated on the figure labels. Cells were mounted on Ussing chambers to measure CFTR mediated chloride channel. After stabilization of the basal current, forskolin (10 μM) was added to the basolateral chambers followed by CFTR potentiator, Ivacaftor (10 μM), and CFTR Inhibitor 172 (10 μM) added to the apical chambers. Right: the bar plot indicates recovery of CFTR function upon treatment of cells with BPN-15477. Change in Isc (ΔIsc), a measure of CFTR function, was defined as the current inhibited by Inh-172 after sustained Isc responses were achieved upon stimulation with forskolin (Fsk, n = 4 Isc measurements per treatment) alone or sequentially with ivacaftor (Iva, n = 2 Isc measurements per treatment). Data are presented as mean values ± SD. The statistical significance is determined via two-tailed Welch’s t-test when forskolin-stimulated CFTR function was compared between BPN-15477 treated and DMSO (vehicle) treated cells. The unadjusted p values are displayed. In the figure, *p < 0.05; **p < 0.01; ***p < 0.001.

