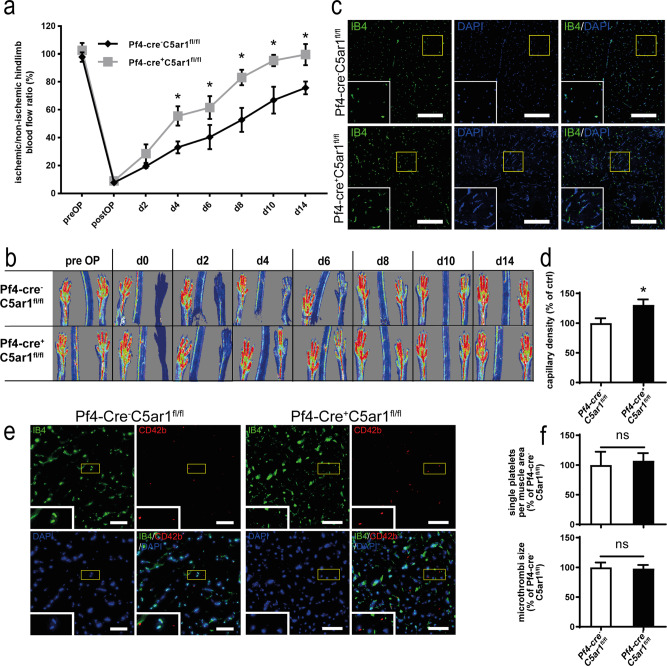
Fig. 4. Platelet-specific C5a receptor deletion inhibits revascularization but does not alter platelet deposition in vivo.
Pf4-cre+ C5ar1fl/fl mice were generated as described in the “Methods” section. Hindlimb ischemia was induced, and Pf4-cre− C5ar1fl/fl mice served as controls. a Platelet-specific C5a receptor 1 knockout mice showed increased revascularization. Data are presented as the mean ± SEM (n = 5 animals per group) and are displayed as the percentage of the perfusion in the contralateral control limb. *p < 0.05. b Representative LDI images of mouse hindlimbs after femoral artery ligation illustrate increased revascularization in Pf4-cre+ C5ar1fl/fl mice compared with littermate control animals. c Vessel density in the representative gastrocnemius muscle sections (vessel marker IB4 in green, nuclei in blue) of the ischemic limbs of Pf4-cre+ C5ar1fl/fl showed significantly higher vessel density than Pf4-cre− C5ar1fl/fl controls. Scale bars represent 200 µm. d Quantification of the IB4-positive area fraction in the muscle sections reveals higher vessel abundance in ischemic Pf4-cre+ C5ar1fl/fl hindlimbs at ×200 magnification. Data are shown as the mean ± SEM (n = 10 whole-muscle sections per group) and are displayed as the percentage of control. The IB4-positive area fraction in Pf4-cre− C5ar1fl/fl hindlimbs represents 100%. *p < 0.05. e By staining for CD42b (red), platelet deposition was quantified in whole-muscle sections of Pf4-cre+ C5ar1fl/fl or of Pf4-cre− C5ar1fl/fl mice, as described in the “Methods” section. No difference in the number of platelets per area or microthrombi size was detected. Displayed are representative images for both genotypes, IB4 staining (green) depicts vascular structures; DAPI (blue) depicts nuclei. Scale bars represent 100 µm. f CD42b-positive single platelets were quantified by size using automated digital image analysis as described in the “Methods” part in whole-muscle sections. There was no significant difference between Pf4-cre+ C5ar1fl/fl and Pf4-cre− C5ar1fl/fl mice both with respect of the number of platelets per muscle area as well as the size of the platelets/microthrombi. Data are shown as the mean ± SEM (n = 6 whole-muscle sections per group) and are displayed as the percentage of control. The readings in Pf4-cre− C5ar1fl/fl hindlimbs represent 100% in both graphs. *p < 0.05. Two-way ANOVA with Bonferroni’s post hoc test in a. Two-sided Student’s t test in d, f.

