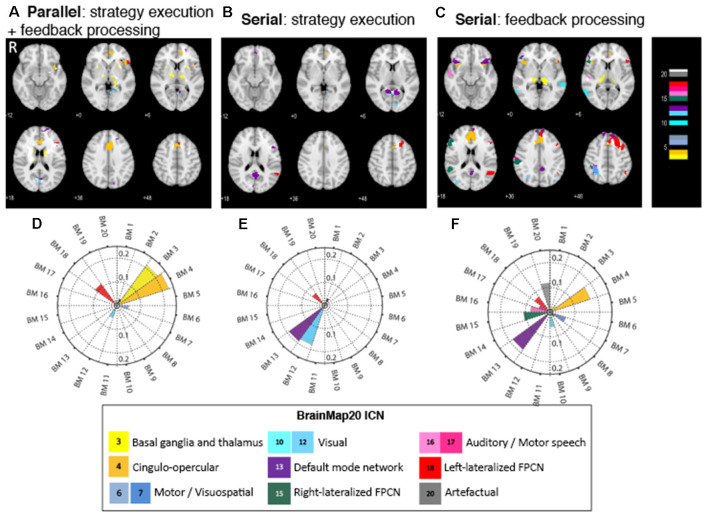
Figure 3.
(A–C) Brain regions activated in the NF subcomponents across the three different conditions. Color code corresponds to the BrainMap20 (Laird et al., 2011) atlas base map. (D–F) Spatial correlation of brain activity in NF with the BrainMap20 intrinsic connectivity networks (ICNs). FPCN, frontoparietal control network. Thresholded and unthresholded activation maps are available at https://neurovault.org/collections/7730.

