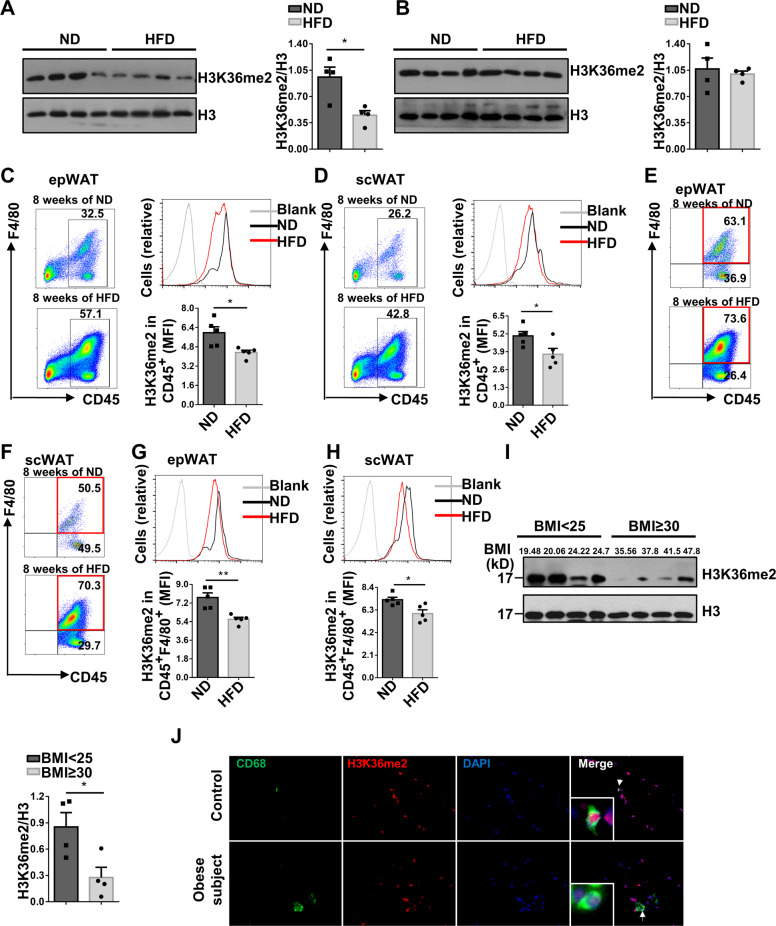
Fig. 1. Obesity is featured by the reduced H3K36me2 levels in ATMs.
H3K36me2 levels in epWAT (A) and scWAT (B) of mice fed ND or HFD for 8 weeks (n = 4/group). Flow cytometry analysis of H3K36me2 status in CD45+ cells from epWAT (C) and scWAT (D) of mice fed with ND or HFD for 8 weeks. Left: a representative flow cytometry data; right: quantitative data from all mice analyzed (n = 5/group). Representative FACS plots showing the proportion of F4/80+ cells gated on CD45+ cells from epWAT (E) and scWAT (F) of mice fed with ND or HFD for 8 weeks. Representative FACS plots and quantitative data of H3K36me2 levels in macrophages from epWAT (G) and scWAT (H) of mice after 8 weeks of HFD or ND feeding (n = 5/group). I Western blot analysis of H3K36me2 levels in CD45+ cells isolated from scWAT of controls (n = 4) and obese subjects (n = 4). J Representative immunostaining results for CD68 and H3K36me2 in scWAT sections from controls and obese subjects. Scale bars: 50 μm. Original magnification: ×400. Values are expressed as mean ± SEM, and unpaired Student’s t test was employed for data analysis. *P < 0.05; **P < 0.01.

