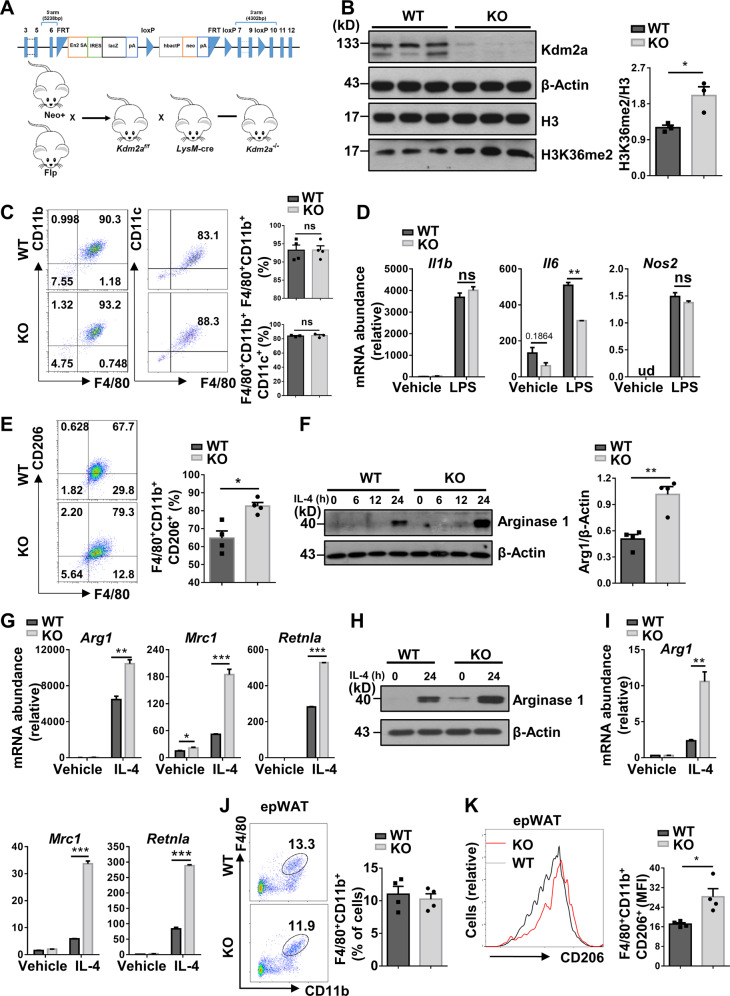
Fig. 2. Kdm2a deficiency orchestrates alternative activation of macrophages.
A Strategy for generating a conditional Kdm2a-deficient model. Kdm2a exons 7–9 were flanked by a neo-flippase recognition target (FRT) and two loxP sites. The neo-gene was deleted after Flp recombination and the Kdm2a exons were then excised by Cre recombinase. B Western blot analysis of Kdm2a and H3K36me2 levels in BMDMs from WT and KO mice, and a bar graph showing data derived from three mice in each group. C Flow cytometry analysis of the expression of F4/80, CD11b, and CD11c in BMDMs stimulated with LPS for 24 h. The percentages of F4/80+CD11b+ and F4/80+CD11b+CD11c+ cells are shown. D RT-PCR analysis of relative mRNA expression of M1 marker genes in BMDMs stimulated with LPS for 6 h. E Flow cytometry analysis of the expression of F4/80, CD11b, and CD206 in BMDMs stimulated with IL-4 for 24 h. Percentages of F4/80+CD11b+CD206+ cells are shown in the bar graphic figure. F Western blot analysis of Arg1 expression in BMDMs stimulated with IL-4 with indicated time. G RT-PCR analysis of relative mRNA levels of M2 genes in BMDMs stimulated with IL-4 for 6 h. H Western blot analysis of Arg1 expression in peritoneal macrophages with or without IL-4 stimulation for 24 h. I RT-PCR analysis of relative mRNA levels of M2 genes in peritoneal macrophages stimulated with or without IL-4 for 6 h. J Representative FACS plots and the percentages of F4/80+CD11b+ cells in epWAT of ND-fed WT and KO mice at 16 weeks of age (n = 4/group). K Expression of CD206 in F4/80+CD11b+ cells as shown in (J). The amounts of F4/80+CD11b+CD206+ cells were quantified and shown as relative mean fluorescence intensity (MFI). Results are representative of three to four independent experiments (B–I). Values are expressed as mean ± SEM, and unpaired Student’s t test was used for data analysis. *P < 0.05; **P < 0.01; ***P < 0.001. ns not significant, ud undetected, Arg1 Arginase 1.

