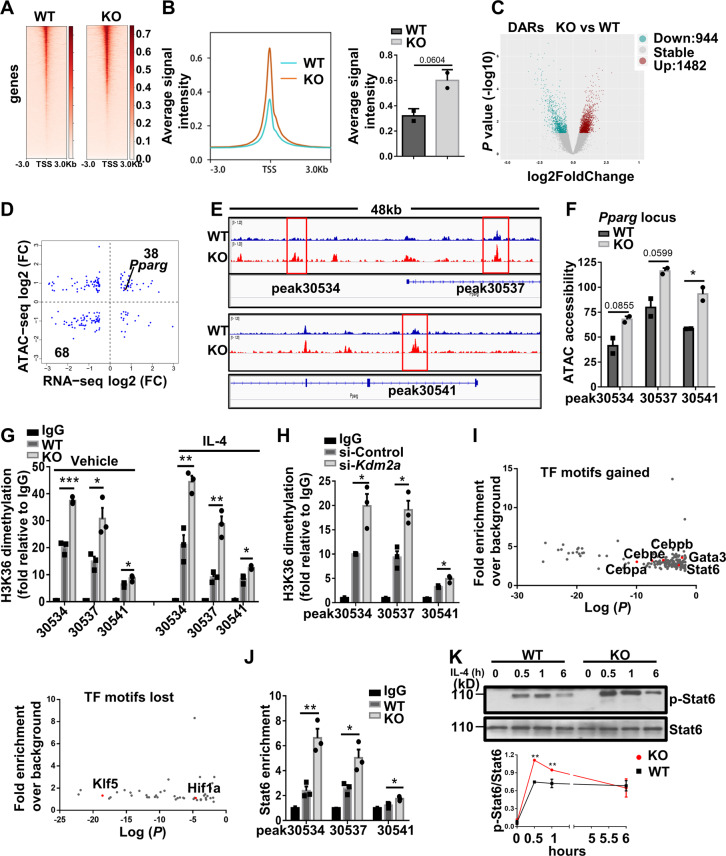
Fig. 7. Loss of Kdm2a promotes Pparγ transcription by inhibiting H3K36me2 demethylation along with chromatin remodeling.
A Average ATAC-seq signal distribution near the TSS. B Average ATAC-seq signals spanning the entire genome visualized in a TSS-centric manner. C Volcano plot of the differentially accessible regions (DARs) between WT and KO BMDMs treated with IL-4 for 6 h, as determined by ATAC-seq. DARs with log2 (fold change) ≥ 0.5, and a P value ≤ 0.05 in KO BMDMs are shown in red (increased accessibility) or blue (decreased accessibility). D Scatter plot of the correlation between DEGs vs. DARs. The number of genes in the quadrants is shown as indicated. E ATAC-seq bedgraph panels of the Pparg locus showing the peak locations relative to the TSS. The panels were compared with ATAC signals between WT and KO BMDMs following IL-4 stimulation. F ATAC peak strength (y-axis) for the selected peaks within the Pparg locus. G Results of ChIP-qPCR to compare H3K36me2 levels in the DARs of Pparg in WT and KO BMDMs treated with vehicle or IL-4 for 6 h. H Results of ChIP-qPCR to compare H3K36me2 levels in the DARs of Pparg in si-Control or si-Kdm2a transfected RAW264.7 cells after IL-4 stimulation for 6 h. I Enrichment of TF binding motifs in DARs of KO BMDMs gained or lost vs. WT BMDMs after IL-4 treatment. J ChIP-qPCR was performed for Stat6 in the Pparg DARs in WT and KO BMDMs treated with IL-4. K Representative western blot results (above) and a dotted line graph (below) showing the temporal expression of p-Stat6 in BMDMs after IL-4 stimulation. The data in (A–F) and (I) were derived from two independent biological replicates, and there were two mice for each biological replicate. Data are representative of three independent experiments for figures (G, H, J, K). Values are presented as mean ± SEM. Statistical significance was determined by the unpaired Student’s t test in (B, F–H, J, K). *P < 0.05; **P < 0.01.

