Fig. 2.
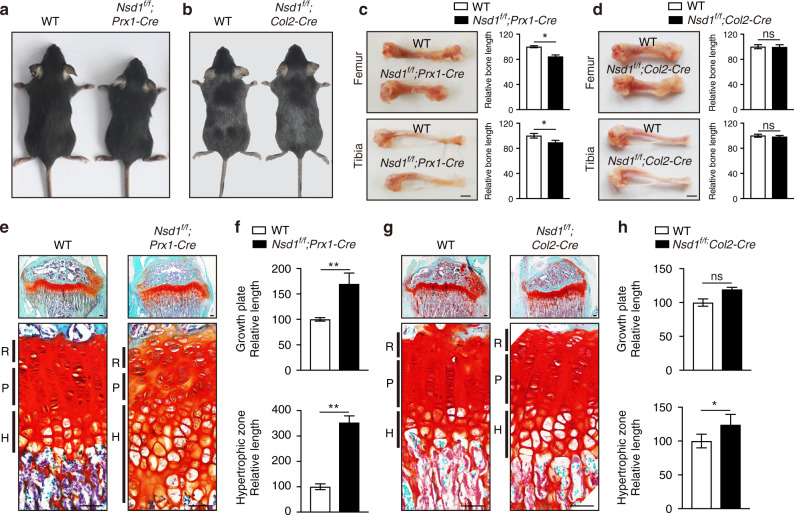
Nsd1 deficiency in mesenchymal progenitors led to skeletal growth defects in mice. Gross images of 1-month-old WT, Nsd1f/f;Prx1-Cre (a) and Nsd1f/f;Col2-Cre (b) mice. Pictures of hindlimbs (left) and quantitative statistics (right) of hindlimb length in 1-month-old WT, Nsd1f/f;Prx1-Cre (c) and Nsd1f/f;Col2-Cre (d) mice. Scale bar = 2 mm. The values are presented as the means ± SEMs, n = 6. *P < 0.05, ns means not significant. Safranin O (SO) staining results (e, g) and growth plate quantification data (f, h) of tibia sections from 1-month-old WT, Nsd1f/f;Prx1-Cre (e, f) and Nsd1f/f;Col2-Cre (g, h) mice. Scale bar (top) = 100 μm. Scale bar (bottom) = 50 μm. The values are presented as the means ± SEMs, n = 6. *P < 0.05, **P < 0.01, ns means not significant

