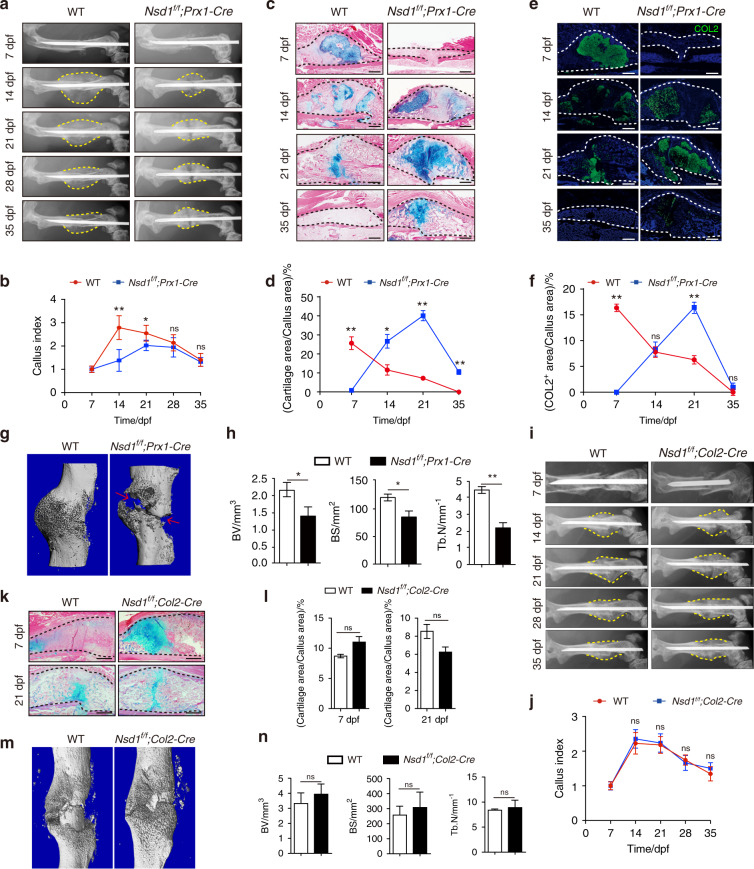
Fig. 3.
Mice with Nsd1 knockout in mesenchymal progenitors showed impaired fracture healing. a Radiographs of fractured femurs from WT and Nsd1f/f;Prx1-Cre mice at different days post fracture (dpf). b Quantitative analysis of formed calluses at different days post fracture (dpf). n = 5. Alcian blue/eosin staining (c) and quantitative results (d) of callus sections. The dashed black lines show the location of the callus. Scale bar = 500 μm. n = 5. Immunofluorescence staining (e) and quantitative results (f) of type II collagen in callus sections. The dashed white lines show the location of the callus. Scale bar= 50 µm. n = 5. g Micro-CT images of calluses in WT and Nsd1f/f;Prx1-Cre mice at 18 dpf. h Quantitative statistics of micro-CT results of calluses. n = 3. i Radiographs of fractured femurs in WT and Nsd1f/f;Col2-Cre mice at different days post fracture (dpf). j Quantitative analysis of formed calluses at different days post fracture (dpf). n = 5. Alcian blue/eosin staining (k) and quantitative results (l) of callus sections. The dashed black lines show the location of the callus. Scale bar = 500 μm. n = 5. m Micro-CT images of calluses in WT and Nsd1f/f;Col2-Cre mice at 21 dpf. n Quantitative statistics of micro-CT results of calluses. BV bone volume, BS bone surface, Tb.N trabecular bone number. n = 3. The values are presented as the means ± SEMs. *P < 0.05, **P < 0.01, ns means not significant

