Fig. 4.
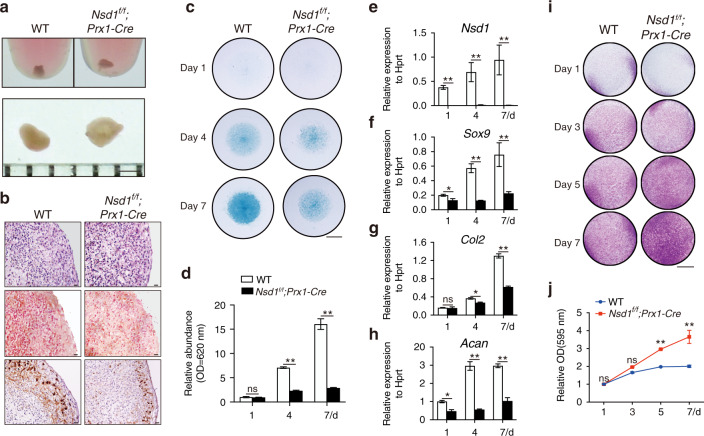
Chondroprogenitor cells with Nsd1 knockout showed impaired chondrocyte differentiation and increased proliferation. a Gross images of pellets formed by chondroprogenitor cells from neonatal mice. Scale bar = 1 mm. b HE staining (top), SO staining (middle), and Col2 in situ hybridization (bottom) results of sections from pellets formed by chondroprogenitor cells. Scale bar = 20 μm. c Alcian blue staining results of micromasses cultured for 1, 4, and 7 days with chondroprogenitor cells. Scale bar = 2 mm. d Quantitative analysis of Alcian blue staining. The values are presented as the means ± SEMs, n = 4. **P < 0.05, ns means not significant. qRT-PCR results for Nsd1 (e) and chondrocyte differentiation marker genes, including Sox9 (f), Col2 (g), and Acan (h), in micromasses cultured for 1, 4, and 7 days with chondroprogenitor cells. The values are presented as the means ± SEMs, n = 4. *P < 0.05, **P < 0.01, ns means not significant. i Crystal violet staining results of chondroprogenitor cells cultured for 1, 3, 5, and 7 days. Scale bar = 5 mm. j Quantification of crystal violet staining. The values are presented as the means ± SEMs, n = 6. **P < 0.01, ns means not significant

