Fig. 5.
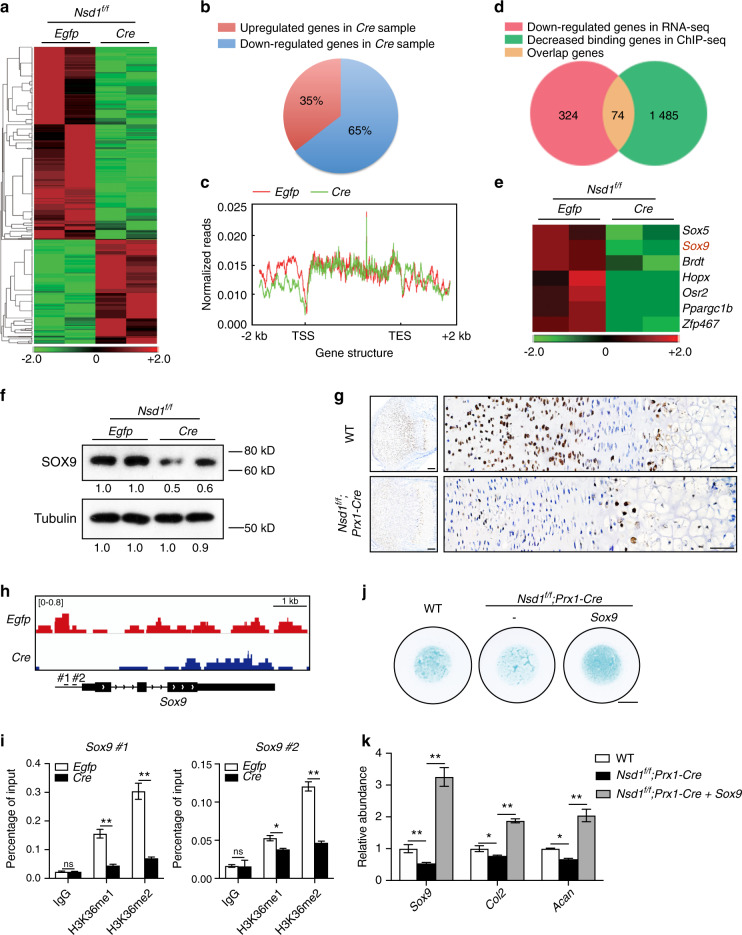
Sox9 was regulated by NSD1 through H3K36 methylation. a Heat map of RNA-seq results for Egfp- and Cre-expressing immortalized Nsd1f/f chondroprogenitor cells. b Pie chart showing the percentages of differentially expressed genes between Egfp and Cre samples. c Normalized reads of H3K36me2 ChIP-seq analyses in Egfp- and Cre-expressing immortalized Nsd1f/f chondroprogenitor cells from 2 kb upstream of the TSS to 2 kb downstream of the TSS in the genome. d Venn diagram showing the numbers of genes with decreased expression in RNA-seq data (pink), genes with decreased H3K36me2 occupancy in ChIP-seq data (green), and overlapping genes (yellow). e Heat map and annotation of transcription factors from the set of overlapping genes. f Western blot analysis of SOX9 in Egfp- and Cre-expressing immortalized Nsd1f/f chondroprogenitor cells. g Immunohistochemical assay of SOX9 in growth plate sections from P7 mice. Scale bar (left) = 100 μm, scale bar (right) = 5 μm. h H3K36me2 binding peaks on Sox9 in Egfp- and Cre-expressing immortalized Nsd1f/f chondroprogenitor cells from the H3K36me2 ChIP-seq assay. i ChIP-PCR assay of H3K36me1 (left) and H3K36me2 (right) occupancy of Sox9. The values are presented as the means ± SEMs, n = 3. *P < 0.05, **P < 0.01, ns means not significant. j Alcian blue staining results of micromass culture with chondroprogenitor cells without or with Sox9 overexpression. Scale bar = 2 mm. k qRT-PCR results of Sox9, Col2, and Acan in micromass culture. The values are presented as the means ± SEMs, n = 4. *P < 0.05, **P < 0.01

