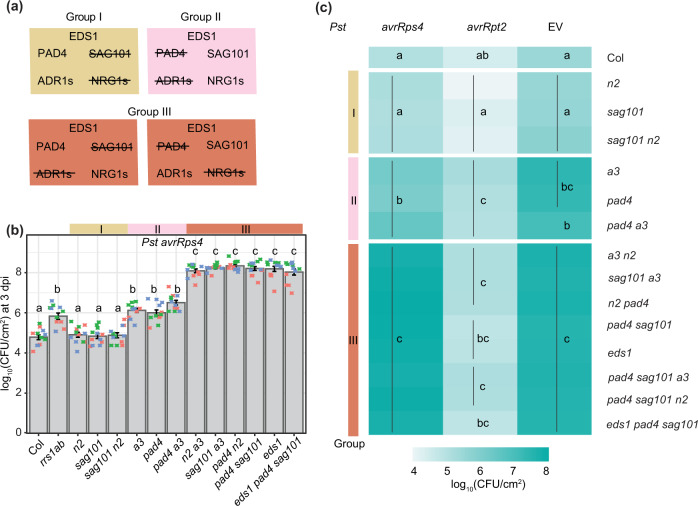
Fig. 1. Distinct PAD4–ADR1 and SAG101–NRG1 modules operate in Arabidopsis TNLRRS1–RPS4 immunity.
a Overview of mutants used in (b) and (c). Group I comprises mutants disabled in SAG101 and/or NRG1s: sag101, nrg1.1 nrg1.2 (n2) and sag101 n2. Group II has mutants in PAD4 and/or ADR1s: pad4, adr1 adr1-L1 adr1-L2 (a3) and pad4 a3. Group III is composed of cross-branch combinatorial mutants a3 n2, sag101 a3, pad4 n2, pad4 sag101, sag101 pad4 a3, sag101 pad4 n2, eds1 pad4 sag101. b Growth of Pseudomonas syringae pv. tomato DC3000 (Pst) avrRps4 in leaves of Arabidopsis Col-0 (Col) and indicated mutants at 3 days post inoculation (dpi) via syringe infiltration (OD600 = 0.0005). Bacterial loads are shown as log10 colony-forming units (CFU) per cm2. Experiments were performed three times independently with four replicates each (Tukey’s HSD, α = 0.001, n = 12). Error bars represent standard error of mean. Datapoints with the same colour come from one independent experiment. c Growth of Pst avrRps4, Pst avrRpt2 or Pst (empty vector, EV) in indicated Arabidopsis lines at 3 dpi infected via syringe infiltration (OD600 = 0.0005). Heatmap represents mean log10-transformed CFU values from three (Pst avrRps4), four (Pst) or five (Pst avrRpt2) independent experiments, each with four replicates (n = 12 for Pst avrRps4, n = 16 for Pst, n = 20 for Pst avrRpt2). Statistical significance codes are assigned based on Tukey’s HSD (α = 0.001). sag101 a3 and pad4 n2 phenocopy pad4 sag101 and a3 n2, indicating that SAG101 does not form functional signalling modules with ADR1s, and NRG1s with PAD4. Note: significance codes are assigned based on the statistical analysis per treatment and should be read columnwise. The jitter plot in b shows individual data points used to calculate means on the heatmap for Pst avrRps4 infection. Pst Pseudomonas syringae pv. tomato DC3000, CFU colony-forming units, EV empty vector.

