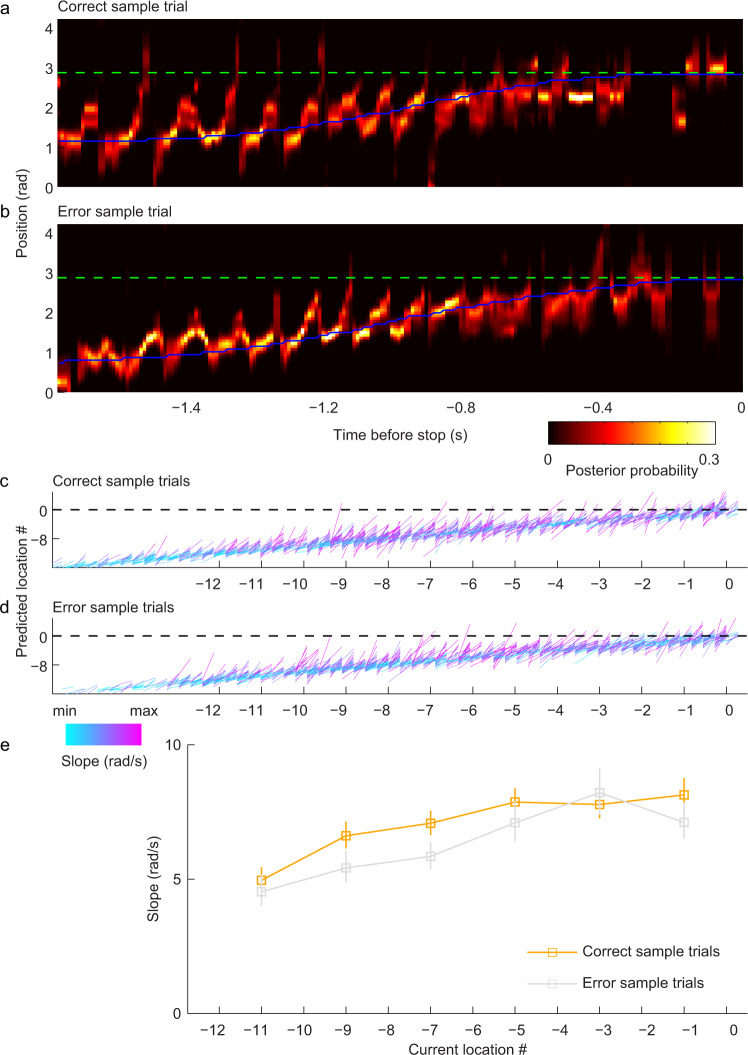
Fig. 4. Place cell sequences exhibited steeper slopes in correct sample trials than in error sample trials.
a–e Same as (a–e) in Fig. 3 but for sample trials. Note that correct and error trials were defined by rats’ responses in subsequent test trials (main effect of trial type: F(1,2838) = 15.9, p = 6.9 × 10⁻⁵, n = 1818 positive sequences detected from correct sample trials and n = 1032 positive sequences detected from error sample trials). Data are presented as mean ± error bars (95% bootstrapped confidence intervals) in (e).

