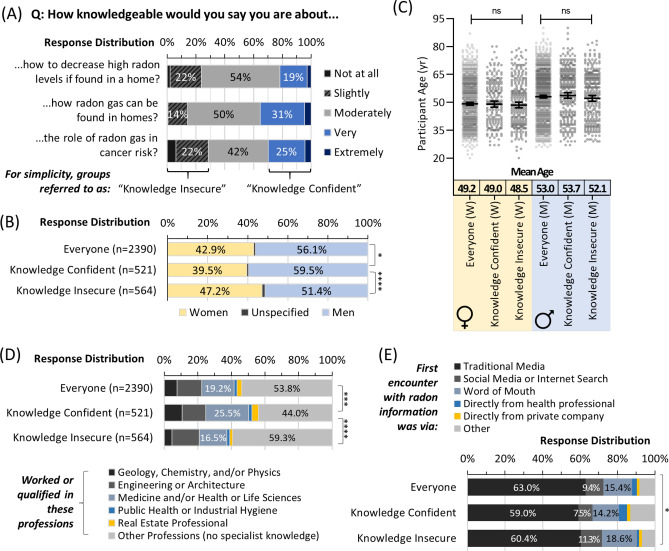
Figure 2.
Radon knowledge perceptions differ by profession and sex but not age. Panel (A) Overall distribution of responses to indicated questions on self-perceptions of radon knowledge. Panel (B) Self-perceptions of radon knowledge as a function of sex. Panel (C) Self-perceptions of radon knowledge as a function of sex and age. Mean Age refers to a geometric mean ± CI95%. Panel (D) Self-perceptions of radon knowledge as a function of status (worked or qualified) in professions with or without the potential for a specialist on radon. Panel (E) Self-perceptions of radon knowledge as a function of the first encounter with radon awareness information. Statistical comparisons are Mann–Whitney pairwise nonparametric t-tests of comparisons for scatter plot data or 1-way ANOVA for all other data. **** = p < 0.0001; *** = p < 0.001; * = p < 0.05; ns = p > 0.05. Figures were prepared using Excel and GraphPad Prism 9.1.1 (225) (www.graphpad.com).

